The forex market operates through three major trading windows: the Asian, European, and North American sessions. Of these, the London and New York sessions are the most volatile, while the Asian session—driven primarily by Tokyo and Sydney—trends to move in a tighter range. Because of this, the Asian session often forms consolidation zones, creating ideal conditions for breakout trading.
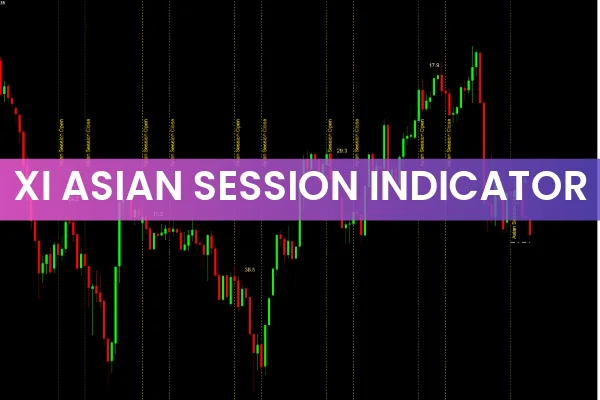
This is where the Xi Asian Session Indicator for MT4 becomes especially useful. The indicator highlights the Asian session range directly on your chart, helping traders identify low-volatility consolidation and prepare for explosive breakouts during the London and New York sessions.
The indicator is beginner-friendly, reliable, and works on any currency pair. However, it performs best on the 1-hour timeframe, making it ideal for intraday traders.
How the Xi Asian Session Indicator Works
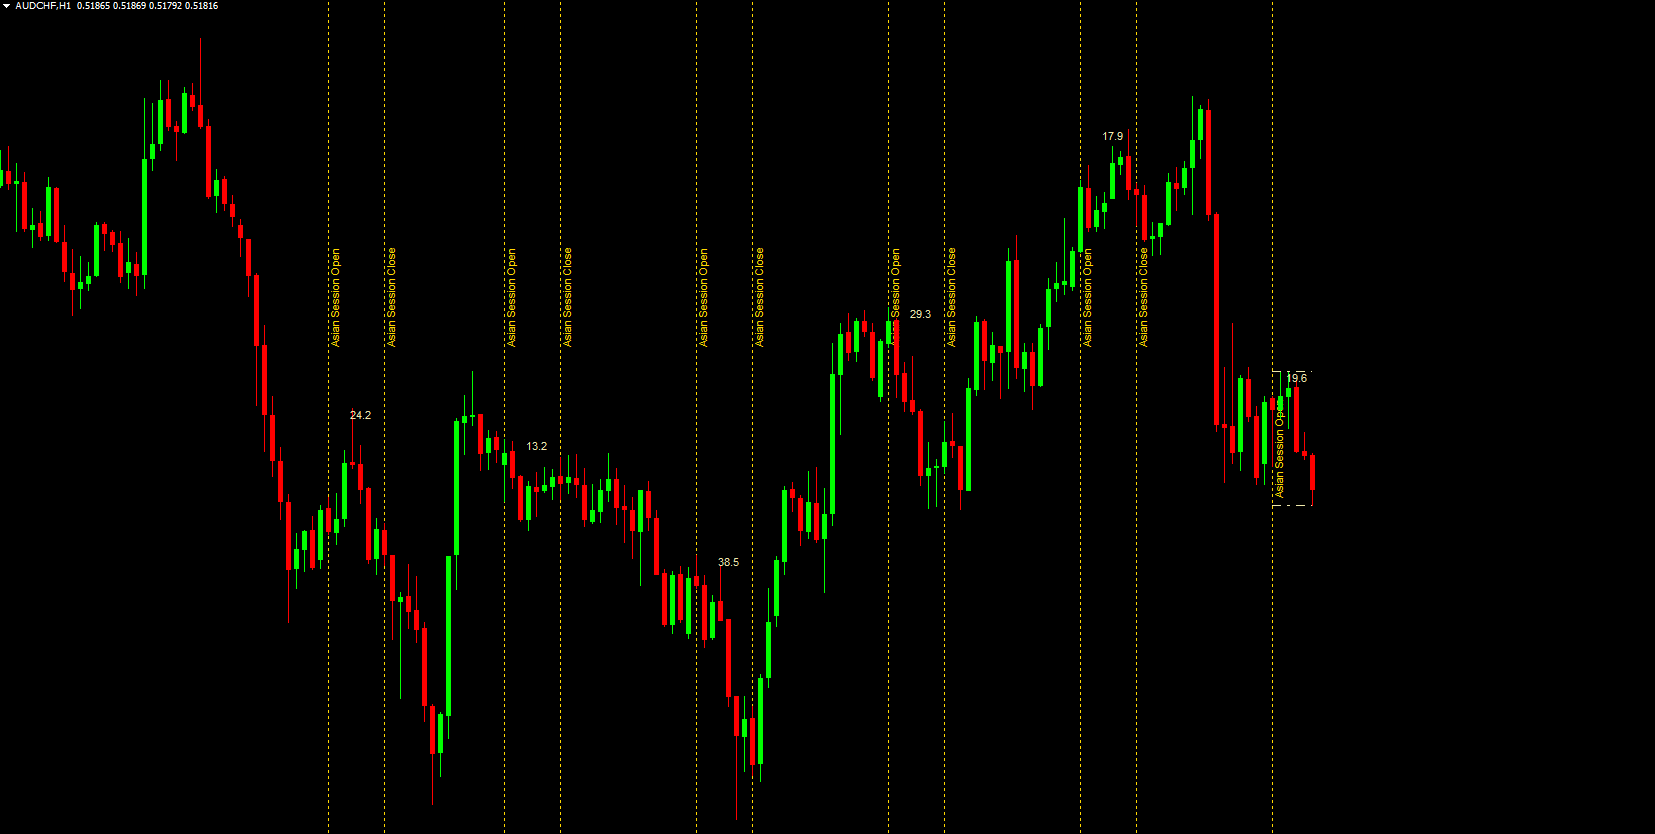
Unlike other MT4 indicators, the Xi Asian Session Indicator does not generate direct buy or sell signals. Instead, it marks the Asian session visually by drawing:
A session opening line at 00:00
A session closing line at 07:00
This clearly shows the overnight consolidation period, allowing traders to observe price behavior during low volatility and prepare for breakout-based strategies.
Xi Asian Session Breakout Trading Strategies
Candlestick Breakout Strategy
This is the simplest and most popular method.
Buy Setup (Long Position)
Wait for the Asian session range to complete.
Look for a bullish candle closing above the range.
Enter long after the breakout candle closes.
Sell Setup (Short Position)
Wait for a bearish candle closing below the range.
Enter short immediately after the candle closes.
This strategy aims to catch the initial momentum when London volatility begins.
The Retouch (Pullback) Method
This strategy is more conservative but often more reliable.
Buy Setup (Retest of Range)
Wait for the price to break above the Asian session range.
Allow price to pull back and retest the top of the range.
Enter long when a bullish signal appears (pin bar, engulfing candle, etc.).
Sell Setup (Retest for Shorts)
Let price break below the Asian range.
Wait for a retest of the lower boundary.
Enter short when a bearish signal forms.
This method filters out false breakouts and provides high-probability entries.
Real Chart Example (GBP/USD H1)
In the provided GBP/USD 1-hour chart:
The green lines show the Asian session boundaries.
Price consolidated during the Asian session (shown by red arrows).
A bullish breakout occurred as London opened.
Price later returned to retest the range, providing a high-quality buying opportunity.
Following the retouch, GBP/USD surged to new highs—allowing traders to capture a large chunk of the upward momentum.
This example demonstrates how effectively the Xi Asian Session Indicator highlights range setups ahead of major market volatility.
Conclusion
The Xi Asian Session Indicator is an excellent tool for traders who rely on range identification and breakout strategies. By clearly marking the Asian session’s start, end, and consolidation structure, the indicator helps traders anticipate high-probability moves during the London and New York sessions.
For best results, combine the indicator with:
Price Action confirmation
Support/resistance levels
Volume or momentum indicators
Used correctly, the Xi Asian Session Indicator can significantly enhance your intraday Breakout Trading Strategy.
FAQ
Published:
Nov 20, 2025 23:44 PM
Category: