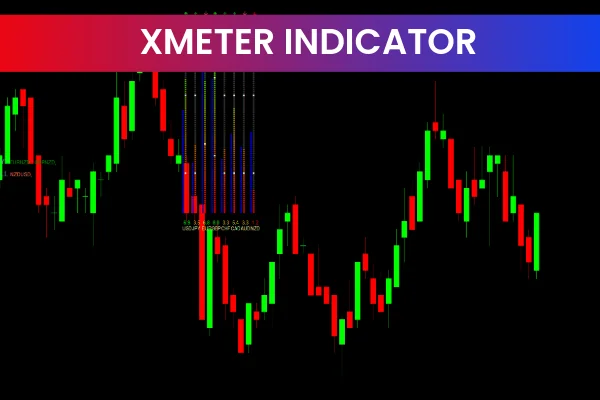
The Xmeter Indicator is a popular and free Forex Indicator designed for the MetaTrader 4 (MT4) platform. It helps traders analyze market conditions, determine the current trend, measure its strength, and predict potential price direction. By providing clear visual signals, the Xmeter Indicator simplifies the process of making informed trading decisions.
Understanding trend direction and strength is essential in Forex trading. The Xmeter Indicator provides this information in a user-friendly format, making it suitable for both beginners and experienced traders.
How the Xmeter Indicator Works
The Xmeter Indicator uses moving averages to evaluate market trends and strength.
Moving Averages and Histogram
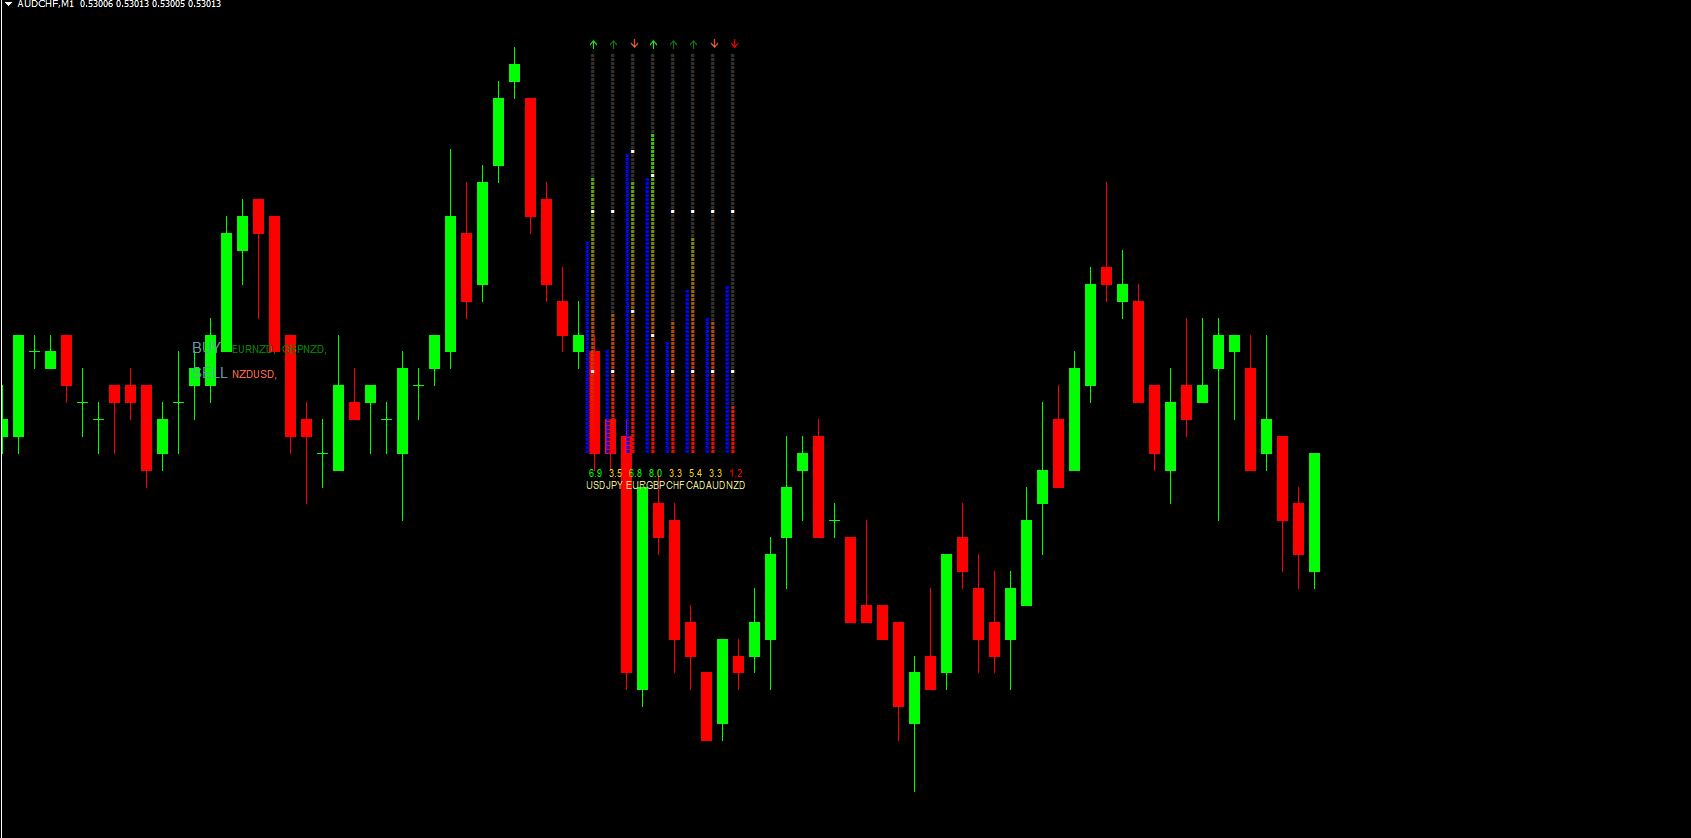
The indicator plots two moving averages on the chart. It then calculates the difference between the two averages and displays it as a histogram.
Histogram above zero: Indicates a bullish trend
Histogram below zero: Indicates a bearish trend
Histogram size: Reflects Trend Strength, with larger bars showing stronger trends
Average Line for Support and Resistance
In addition to the histogram, the Xmeter Indicator plots a line representing the average of the two moving averages. This line helps traders identify potential support and resistance levels where price may react.
Customizable Settings
Traders can easily adjust the moving average periods, histogram colors, and other settings to fit their trading style. The indicator works on any chart and timeframe, offering flexibility for Scalping, day trading, or swing trading strategies.
Key Benefits of the Xmeter Indicator
Trend Direction and Strength
The indicator provides a clear picture of the market trend and its intensity, helping traders stay aligned with the dominant market momentum.
Support and Resistance Identification
The average line serves as a dynamic support or resistance level, helping traders spot potential entry and exit zones.
Easy to Use
The Xmeter Indicator is simple to install and interpret, making it ideal for beginners and convenient for experienced traders.
Free and Lightweight
As a free MT4 indicator, it runs smoothly alongside other technical tools without slowing down the platform.
Trading Strategies Using the Xmeter Indicator
Trend-Following Strategy
Enter long trades when the histogram is above zero and increasing
Enter short trades when the histogram is below zero and decreasing
Use the average line as a dynamic support or resistance reference
Trend Strength Confirmation
Combine the histogram with other indicators, such as RSI or MACD, to confirm trend strength and reduce false entries.
Support and Resistance Trading
Traders can use the average line as a reference for placing stop-loss and take-profit levels, improving risk management.
Multi-Indicator Strategy
For enhanced accuracy, combine the Xmeter Indicator with:
Moving averages for trend confirmation
Candlestick patterns for timing entries and exits
Bollinger Bands or other volatility tools
Who Should Use the Xmeter Indicator
The Xmeter Indicator is ideal for:
Beginner traders learning trend analysis
Intermediate traders refining entry and exit timing
Advanced traders adding trend strength confirmation to their strategies
It can be applied to Forex pairs, indices, commodities, and cryptocurrencies available on MT4.
Final Thoughts
The Xmeter Indicator is a powerful MT4 tool for analyzing market trends, measuring trend strength, and identifying support and resistance levels. Its user-friendly interface, customizable settings, and free availability make it a valuable addition to any trader’s toolkit.
To explore more free MT4 indicators, professional trading tools, and trading strategies, visit IndicatorForest.com and take your trading to the next level.
1 Download
Published:
Dec 31, 2025 12:34 PM
Category: