The XP Moving Average (XPMA) is a powerful indicator that refines traditional moving averages by eliminating false signals during volatile market conditions. It provides a smoothed, color-coded line that dynamically follows price movements—helping traders identify bullish and bearish trends effortlessly.
Whether you are a beginner or an experienced trader, the XPMA Indicator is easy to use and can be integrated into any trading strategy. It works perfectly across all currency pairs, commodities, indices, and timeframes on the MT4 platform.
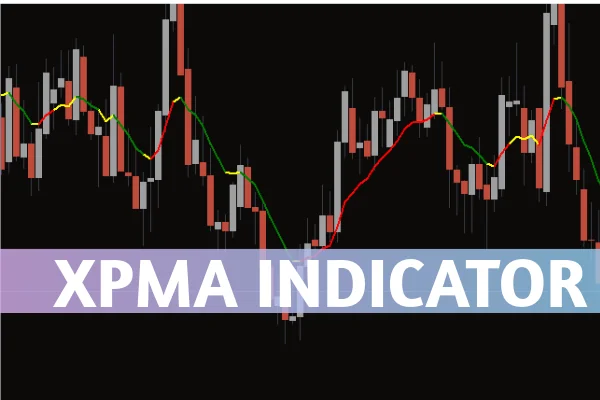
How the XPMA Indicator Works
The XPMA indicator forms a line that adapts to the market trend by changing color based on price direction:
Green indicates a bearish trend (price below the indicator).
Yellow represents a transition zone (possible trend change).
Red indicates a bullish trend (price above the indicator).
This visual approach allows traders to identify momentum shifts at a glance and make timely trading decisions.
XPMA Buy Signal Setup
A buy signal occurs when the XPMA line turns from green to red, indicating a shift to bullish momentum. Here’s how to trade it:
Ensure the price closes above the XPMA line.
Wait for confirmation—such as a bullish candlestick pattern.
Enter a long position when the XPMA color changes to red.
Place your stop loss below the recent swing low or indicator level.
The yellow phase is a warning to prepare for a potential uptrend, similar to an amber light signaling "get ready."
XPMA Sell Signal Setup
A sell signal forms when the indicator turns from red to green, suggesting bearish control. Follow these steps:
Wait for the price to close below the XPMA line.
Confirm with a bearish candlestick pattern if possible.
Enter a short position when the XPMA changes to green.
Set your stop loss above the recent swing high or indicator level.
This setup helps you ride the trend until a reversal is signaled by a color change.
Why Use the XPMA Indicator?
The XPMA Indicator offers several advantages over traditional moving averages:
Reduces noise by filtering out false positives.
Adapts dynamically to price changes.
Easy visual cues through color-coded signals.
Compatible with all MT4 instruments and timeframes.
Ideal for beginners and professionals alike.
By combining XPMA with other tools—such as Support And Resistance Levels or the RSI indicator—you can increase the accuracy of your trades and build a robust trading strategy.
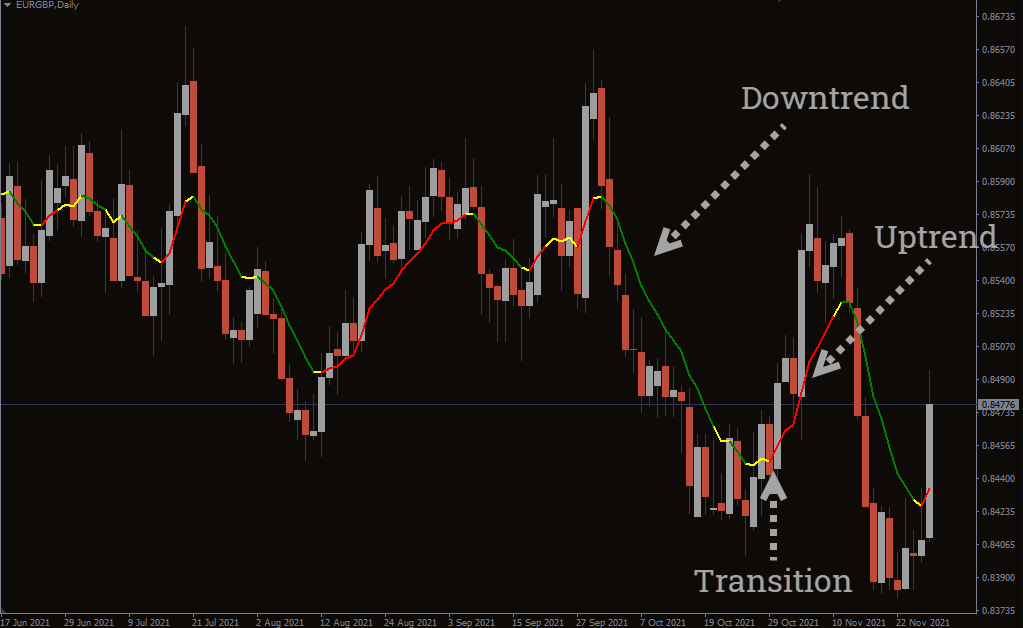
Practical Example: Trading EUR/GBP
Consider a EUR/GBP chart:
During a downtrend, the price stays below the XPMA line, which turns green. When the market shifts upward, the XPMA changes to red, signaling an uptrend. The yellow transition between these colors warns traders to prepare for a potential reversal.
This clear visual feedback makes XPMA a valuable companion for trend traders aiming for consistent profits.
Conclusion
The XPMA Indicator for MT4 is a refined and efficient version of the moving average, providing traders with clear trend identification and smoother trading signals. It’s a perfect blend of simplicity and accuracy, helping you enter trades confidently and manage risks effectively.
If you’re ready to improve your trend-trading strategy, download the XPMA Indicator today at IndicatorForest.com and start trading smarter with trend precision.
2 Downloads
Published:
Oct 31, 2025 09:56 AM
Category: