Optimize Your Chart Analysis with the XU Semafor Button Indicator
In the fast-paced world of Forex trading, visual clarity is one of the most undervalued assets a trader can possess. Standard charts are often cluttered with overlapping indicators, making it difficult to spot genuine market structural shifts. The XU Semafor Button is a premium utility designed to solve this problem, offering a high-performance implementation of the classic Semafor logic with a modern, user-centric interface for MT4 and MT5.
What is the XU Semafor Button?
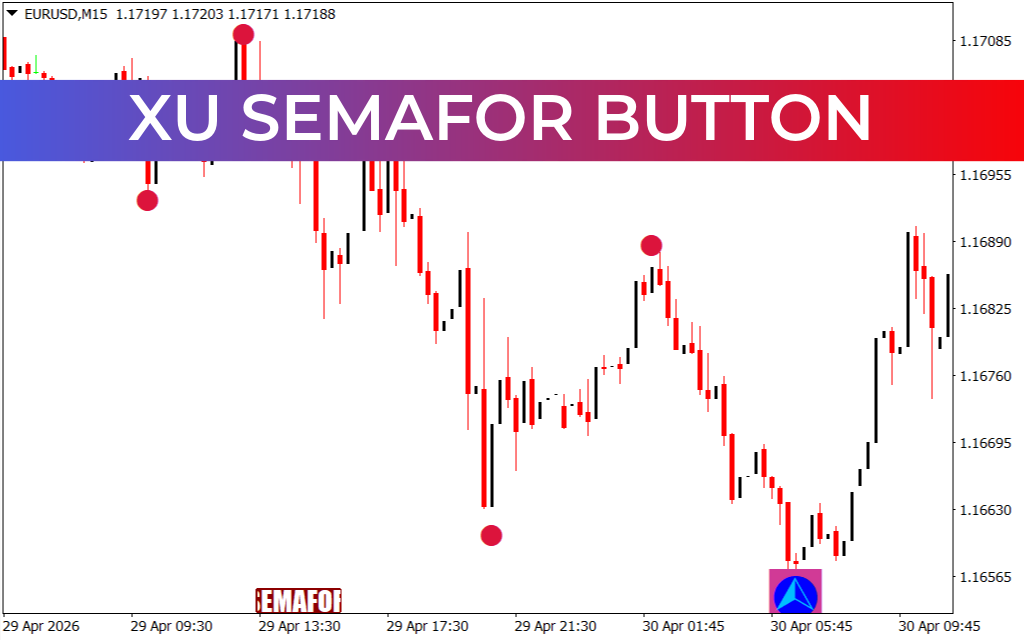
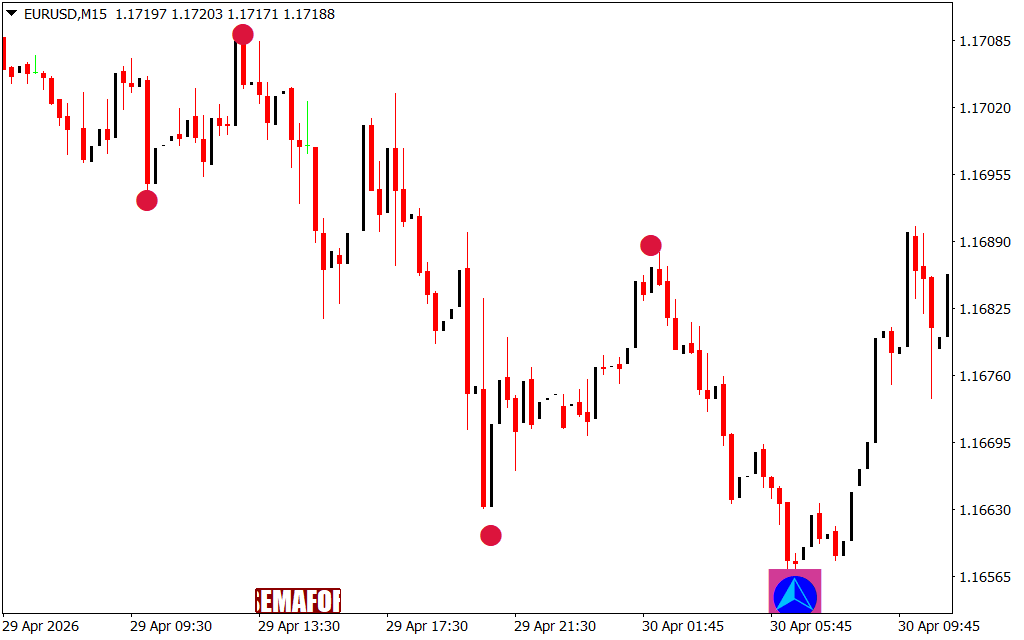
As illustrated in the provided EUR/USD M15 chart, the XU Semafor Button is a structural analysis tool that identifies significant swing highs and swing lows. It utilizes a three-level system to categorize market peaks and troughs:
- Level 1 & 2 (Smaller Dots): These identify minor pullbacks and short-term exhaustion points within a larger trend.
- Level 3 (Large Red Circles): These represent major structural turning points where price has reached a significant exhaustion level. As seen in the example, the large red circles perfectly highlight the "head and shoulders" type patterns and major reversals on the 15-minute timeframe.
The "Button" aspect of this indicator is a game-changer for professional traders. It allows you to toggle the Semafor visualisations on and off with a single click, keeping your charts clean when you need to focus on pure Price Action.
Why Every Price Action Trader Needs This Tool
The XU Semafor Button is built on the principle of ZigZag logic but enhanced to filter out market "noise." It provides several strategic advantages:
- Trend Exhaustion Alerts: When a Level 3 Semafor appears (the large red circle), it signals that the current move is mathematically overextended. This is a critical warning for trend followers to tighten their stop-losses or for contrarian traders to look for reversal entries.
- Structural Mapping: By connecting the large circles, traders can easily visualize the higher highs and lower lows that define Market Structure. This simplifies the process of identifying whether the market is trending or consolidating.
- High-Confluence Entries: When paired with other tools—like the Pirson Momentum Indicator or the Vegas Model—the XU Semafor acts as a powerful confirmation signal. A large red dot appearing at a major Fibonacci resistance level creates a high-probability trade setup.
Strategic Implementation
For the most effective results, traders should use the XU Semafor Button to identify "zones of interest." In the provided chart, notice how the large red dots often precede significant bearish drops. By waiting for a Level 3 signal to appear and then switching to a lower timeframe (like the M1 or M5) for a candlestick entry trigger, traders can achieve incredible risk-to-reward ratios.
Furthermore, the indicator features a built-in "XU" button on the interface, allowing for seamless integration into complex trading workstations. Whether you are a scalper or a swing trader, the ability to instantly visualize structural peaks without permanently cluttering your chart is a massive technical edge.
Conclusion
The XU Semafor Button transforms a standard price chart into a professional structural map. By automating the identification of exhaustion points and offering an intuitive toggle interface, it allows traders to focus on what truly matters: execution. Elevate your technical analysis today and stop missing the major turns in the market.
23 Downloads
Last Update:
May 03, 2026 01:21 AM
Published:
Jan 28, 2026 22:13 PM
Category: