Master Intraday Market Structure with the Zdyn Pivot Indicator
Trading standard, static floor pivots can often leave intraday traders frustrated. Traditional daily pivot points calculate rigid levels based solely on the previous session's high, low, and close, completely ignoring real-time structural shifts within the active trading session. For technical traders navigating liquid currency pairs like the EUR/USD, catching early intraday reversals requires a tool that adapts dynamically to changing price conditions. The Zdyn Pivot indicator bridges this gap by delivering an organic, adaptive perspective on structural Support And Resistance.
What is the Zdyn Pivot Indicator?
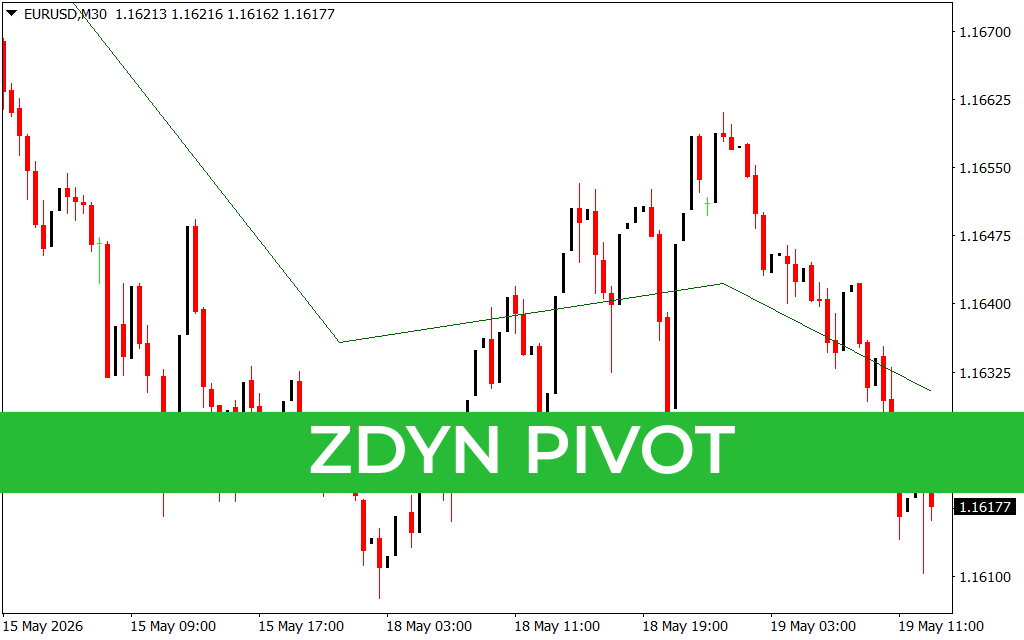
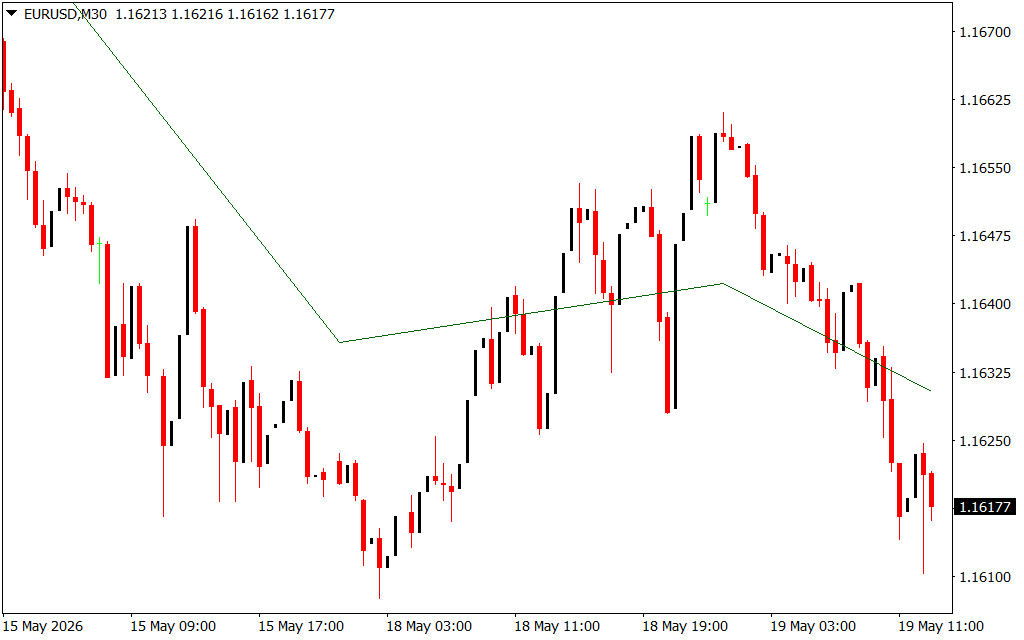
The Zdyn Pivot indicator is a specialized charting utility built for MetaTrader and popular multi-asset platforms. Unlike standard indicators that overlay horizontal, static line grids, the Zdyn Pivot focuses on identifying dynamic baseline equilibrium levels. It uses a mathematical smoothing framework that maps structural price nodes across mid-tier timeframes, such as the 30-minute (M30) chart.
By continuously analyzing recent internal swing legs rather than rigid daily boundaries, the Zdyn Pivot draws a sleek, continuous reference line (shown in green) directly over your candlesticks. This line shifts dynamically based on price expansion, acting as a flexible, rolling axis of value that separates bullish territory from bearish territory.
Key Features and Strategic Advantages
- Adaptive Intraday Mapping: The indicator filters out erratic market noise by connecting micro-structural turning points into a cohesive baseline curve rather than a jagged, lagging moving average.
- Objective Trend Bias Filter: When the candlesticks are trading cleanly below the green Zdyn line, the market maintains an intraday bearish bias. When price breaks and stabilizes above the line, the short-term bias rotates to bullish.
- Visual Simplicity: By eliminating cluttered charts crowded with multiple R1, R2, S1, and S2 horizontal lines, this tool keeps your workspace pristine. It allows you to focus on raw Price Action, candle patterns, and major structural zones.
- Excellent Confluence Tool: It functions beautifully alongside standard oscillators, volume indicators, or higher-timeframe trend filters to pinpoint high-probability trading entries.
How to Trade with Zdyn Pivot
The Zdyn Pivot indicator serves as both a structural filter and a dynamic tracking guide for breakout and pull-back strategies.
- Trading Dynamic Rejections: During an established downward impulse, wait for price to pull back upward toward the green Zdyn baseline. If a candlestick prints a long upper wick or a bearish engulfing pattern as it touches the line, it validates a structural resistance rejection. This offers an optimal entry point to short the market with a tight stop-loss placed just above the baseline.
- Identifying Trend Breakouts: Watch for moments when an asset breaks forcefully through the line after a period of consolidation. If a candle closes decisively on the opposite side of the line, it signals a shift in structural momentum, clearing the path for a new continuation trade.
Streamline your daily chart setups and gain a clearer view of underlying market symmetry by downloading the Zdyn Pivot indicator today.
1 Download
Last Update:
May 19, 2026 16:19 PM
Published:
Jan 19, 2026 19:32 PM
Category: