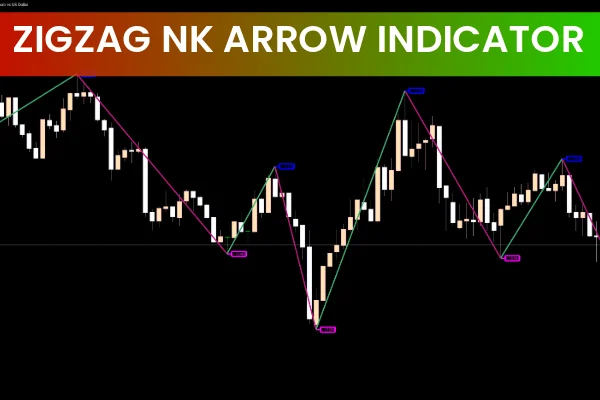
The ZigZag NK Arrows indicator is a powerful technical analysis tool designed to help traders identify clear swing highs and swing lows across any market. In Price Action trading, understanding swing structure is essential, and the ZigZag NK Arrows indicator simplifies this by plotting color-coded arrows directly on the chart. This makes the indicator extremely useful for traders who rely on market flow, trend direction, and pivot zones.
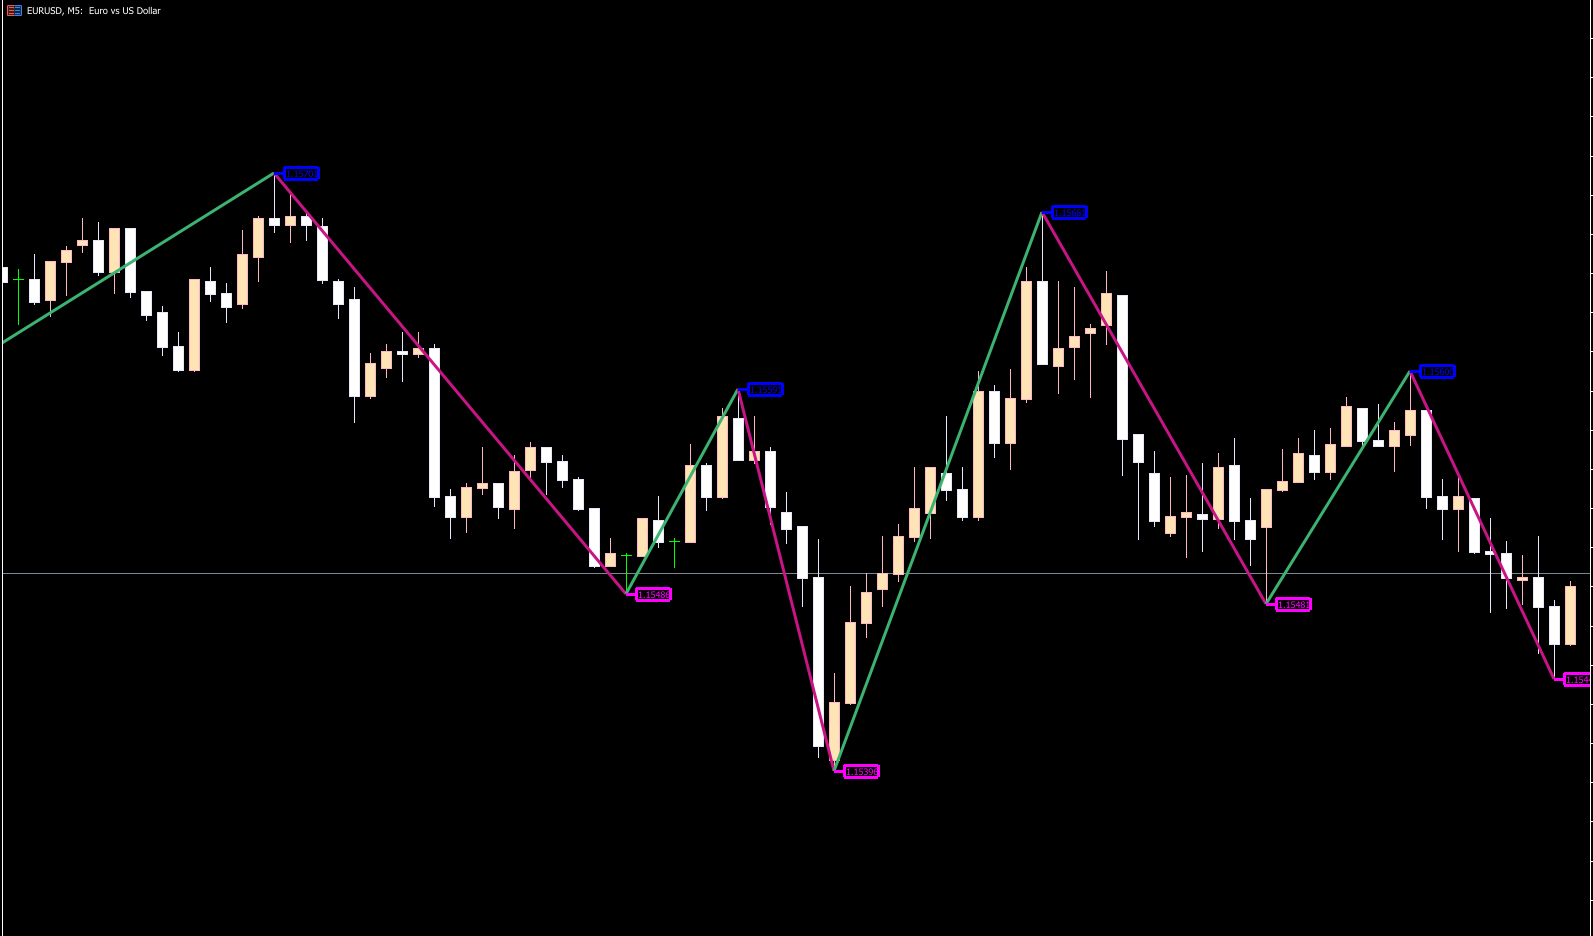
The indicator functions similarly to the classic ZigZag indicator, but instead of connecting points with lines, it uses arrows to highlight turning points. Blue arrows mark swing lows while red or magenta arrows reveal swing highs—making it visually intuitive even for beginners.
How the ZigZag NK Arrows Indicator Helps Price Action Traders
Clear Identification of Swing Levels
Accurately identifying swing highs and lows is crucial when reading Market Structure. The ZigZag NK Arrows indicator removes ambiguity by objectively showing these pivot points. Swing levels allow traders to determine whether price is making higher highs, higher lows, lower highs, or lower lows—key components in defining trend direction.
Perfect for Market Flow Analysis
Users who base their strategy on market flow and trend structure will find the indicator especially helpful. Swing lows marked by blue arrows confirm uptrend structure, while swing highs marked by red arrows signal potential downtrend continuation.
If Your Forex Trading Strategy Is Based on Price Action and Market Flow
Identifying key swing levels is a mandatory skill. Swing lows and swing highs define directional bias and help traders understand where the market is likely to pivot. This is exactly where the ZigZag NK Arrows indicator excels.
The tool works on all timeframes and is suitable for any currency pair or instrument. It is simple, reliable, and effective for both beginners and advanced traders.
Why the ZigZag Arrow Indicator Is Easy to Use
The indicator’s color-coded arrows make swing identification effortless:
Blue up arrows = swing lows
Red/Magenta down arrows = swing highs
Unlike the standard ZigZag lines that form a zigzag pattern, this version visually highlights important price reversal points without cluttering the chart.
Using the ZigZag NK Arrows Indicator to Identify Trends
How to Spot Uptrends
A valid uptrend forms when:
Swing highs are higher than previous swing highs
Swing lows are higher than previous swing lows
Blue arrows will appear at higher levels, giving a clear visual confirmation.
How to Spot Downtrends
A downtrend occurs when:
Swing highs are lower than previous swing highs
Swing lows are lower than previous swing lows
Magenta arrows highlight these turning points, making downtrend structure easy to follow.
How to Trade with the ZigZag NK Arrows Indicator
Buy Signal
Wait for a Blue arrow to form at a swing low
Enter the trade after the candle closes
Place stop-loss below the candle or structure level
Sell Signal
Wait for a Magenta arrow at a swing high
Enter after the candle closes
Place stop-loss above the candle or above swing structure
Once trend direction is established, traders may use additional tools such as chart patterns, candlestick formations, moving averages, or volume analysis to confirm entries.
Example: GBP/AUD Price Action
On a GBP/AUD chart, a magenta arrow marking a swing high indicates a lower high compared to previous structure—confirming a downtrend. A subsequent blue arrow produces a lower swing low, reinforcing continuation. This clear structure helps traders place stop-loss orders safely above the swing high or below the swing low.
Conclusion
The ZigZag NK Arrows indicator is an essential tool for traders who rely on market structure, price action patterns, and trend analysis. It removes confusion from swing identification and helps maintain position clarity during pullbacks or consolidation phases. To explore more powerful trading tools and indicators, visit IndicatorForest.com.
FAQ
21 Downloads
Published:
Dec 02, 2025 02:10 AM
Category: