Zigzag With Fibo Indicator

Zigzag With Fibo Indicator
Free

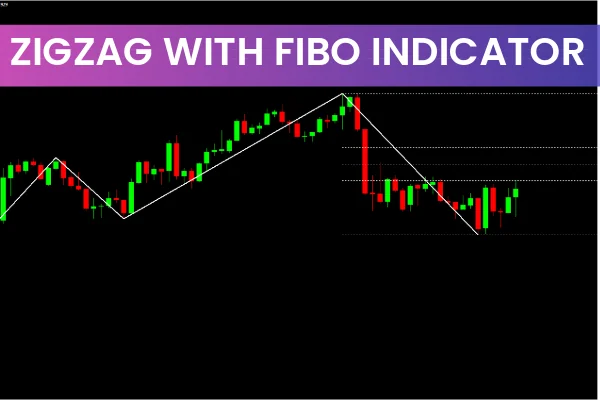
The Zigzag with Fibo indicator for MT4 combines two powerful and time-tested tools to provide high-quality entry and exit signals. The Zigzag helps traders identify the prevailing market trend, while Fibonacci retracement levels highlight optimal entry areas during market pullbacks.

This indicator is effective on all timeframes, making it useful for intraday traders as well as swing and long-term traders. Because of its simplicity and visual clarity, it is suitable for both beginner and experienced forex traders.

How the Zigzag With Fibo Indicator Works

Once installed, the indicator automatically:

Plots the Zigzag structure to identify significant swing highs and swing lows.

Draws Fibonacci retracement levels between the most recent Zigzag high and low.

Continues updating dynamically as new swing points are formed.

This combination makes it easy to see trend direction and locate precise pullback zones where price may react.

Trading Setup Using Zigzag With Fibo

Buy Signal – Uptrend

During an uptrend:

Wait for the Zigzag to confirm a higher low.

The indicator then plots Fibonacci retracement levels from the swing low to the swing high.

Enter a BUY position when price retraces and bounces from the first two Fibonacci levels (typically 38.2% or 50%).

A break below these levels may signal a deeper correction or the start of a Trend Reversal.

A good stop-loss level is placed below the previous Zigzag low.

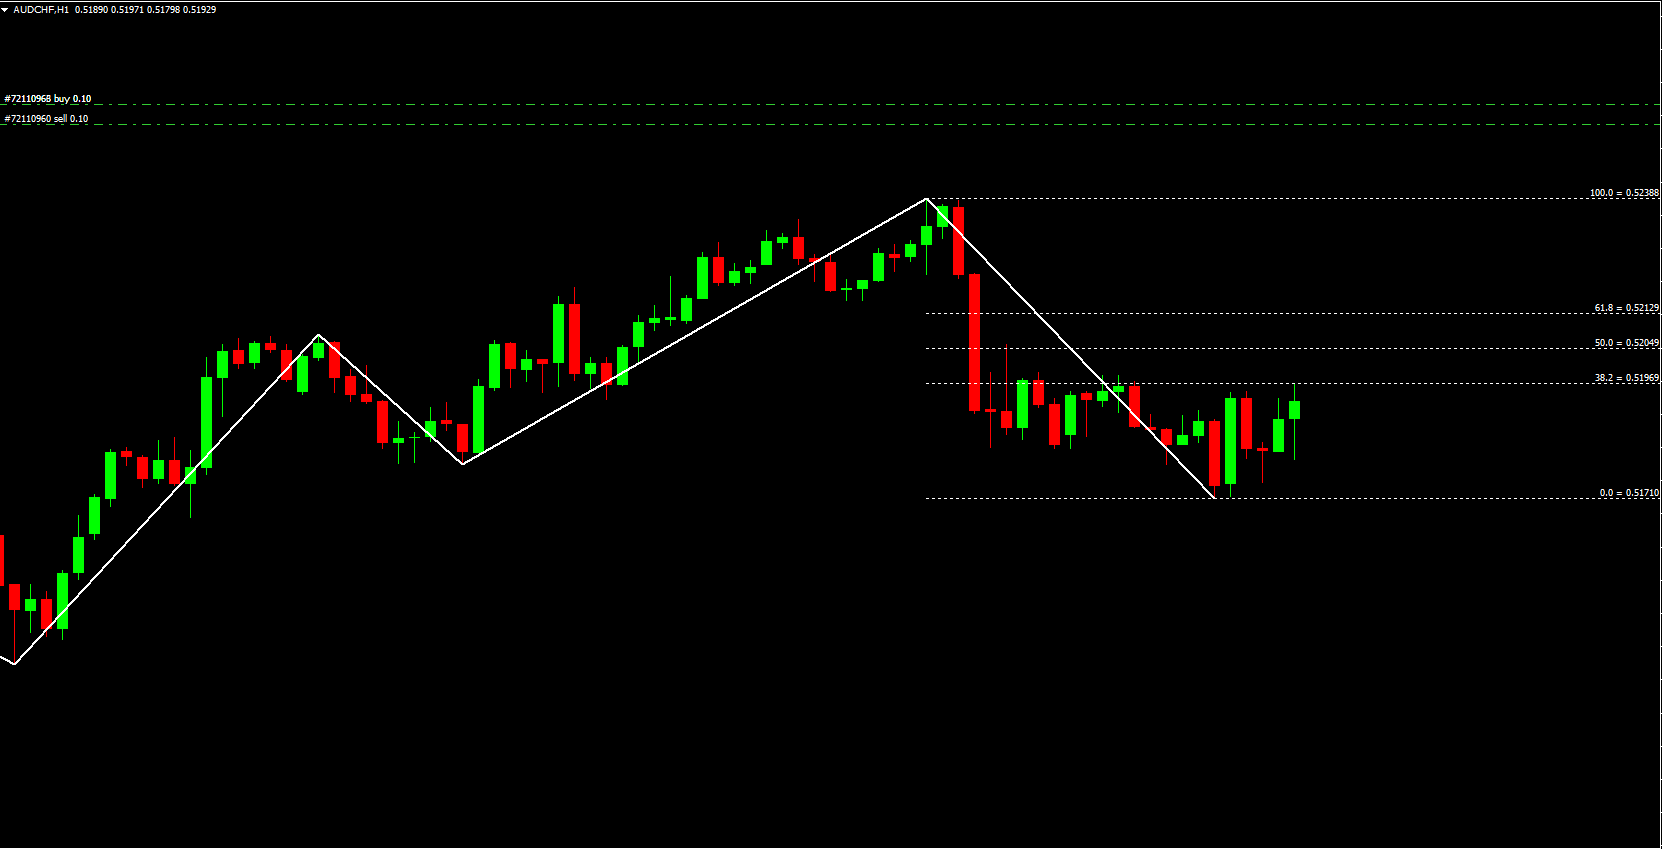
Sell Signal – Downtrend

During a downtrend:

The Zigzag identifies a lower high, triggering Fibonacci retracement plotting.

Enter a SELL position when price retraces upward and rejects key Fibonacci levels.

Place stop loss above the prior Fib level or above the Zigzag reversal point.

This method is based on the idea that price often resumes its trend direction after a Fibonacci pullback.

Tip: Always combine Fib bounces with Price Action confirmation—candlestick patterns, wicks, or structure breaks increase signal reliability.

Conclusion

The Zigzag with Fibo indicator for MT4 blends two complementary tools to form a simple yet effective trend-following strategy. It provides:

Clear trend identification

Logical pullback entry zones

Intuitive stop-loss placement based on structure

This makes it a powerful addition to any trader's technical toolkit.

FAQ

It plots zigzag trend lines identifying swing highs/lows, then automatically draws Fibonacci retracement levels between them.

It plots zigzag lines connecting swing highs/lows and automatically draws Fibonacci retracement levels between them.

It plots zigzag lines connecting swing highs/lows and automatically draws Fibonacci retracement levels between them.

It plots zigzag lines connecting swing highs/lows and automatically draws Fibonacci retracement levels between them.

In uptrend, wait for zigzag higher low, then buy on Fibonacci bounce (38.2% or 50%) with stop below swing low.

In uptrend, zigzag shows higher low, then buy on Fibonacci bounce (38.2% or 50%) with stop below swing low.

In uptrend, zigzag shows higher low, then buy on Fibonacci bounce (38.2% or 50%) with stop below swing low.

In uptrend, zigzag shows higher low, then buy on Fibonacci bounce (38.2% or 50%) with stop below swing low.

In downtrend, zigzag shows lower high, then sell on rejection of Fib levels (61.8% or 78.6%) with stop above swing high.

In downtrend, zigzag shows lower high, then sell on rejection of Fib levels (61.8% or 78.6%) with stop above swing high.

In downtrend, zigzag lower high triggers Fib levels; sell on rejection of 61.8% or 78.6% with stop above swing high.

In downtrend, zigzag shows lower high, then sell on rejection of Fib levels (61.8% or 78.6%) with stop above swing high.

Zigzag identifies key swings, Fibonacci shows precise retracement levels where price often reverses or continues.

Zigzag identifies key swings, Fibonacci shows precise retracement levels where price often reverses or continues.

Zigzag identifies key swings, Fibonacci shows precise pullback levels where price often reverses or continues.

Zigzag identifies key swings, Fibonacci shows precise retracement levels where price often reverses or continues.

Automatic plotting eliminates drawing errors, providing consistent entry zones for pullback trading.

Automatic plotting eliminates manual drawing errors, providing consistent entry zones for pullback trades.

Automatic plotting eliminates drawing errors, providing consistent entry zones for pullback trading.

Automatic plotting eliminates drawing errors, providing consistent entry zones for pullback trading.
3 Downloads

Published:

Nov 21, 2025 08:01 AM

Category:

We use cookies to personalize your experience. By continuing to visit this website you agree to our use of cookies

GDPR and cookie policy