The ZZ SR TL Indicator for MT4 automatically plots Support And Resistance levels using the classic ZigZag structure. By connecting key swing highs and lows, the tool highlights precise trend lines that help traders identify high-probability buy and sell zones. Because it is simple, visual, and intuitive, the indicator is suitable for beginners and advanced traders alike.
It performs exceptionally well on all timeframe types—including Scalping charts, intraday setups, swing trading, and long-term analysis—making it a versatile addition to any trading strategy.
ZZ SR TL Indicator for MT4 – Trading Signals
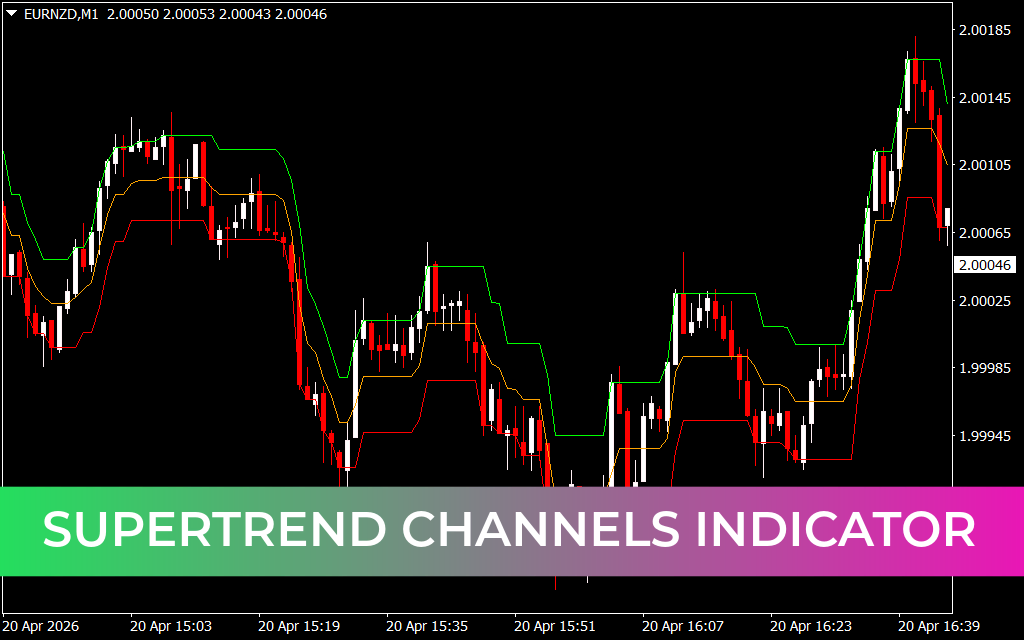
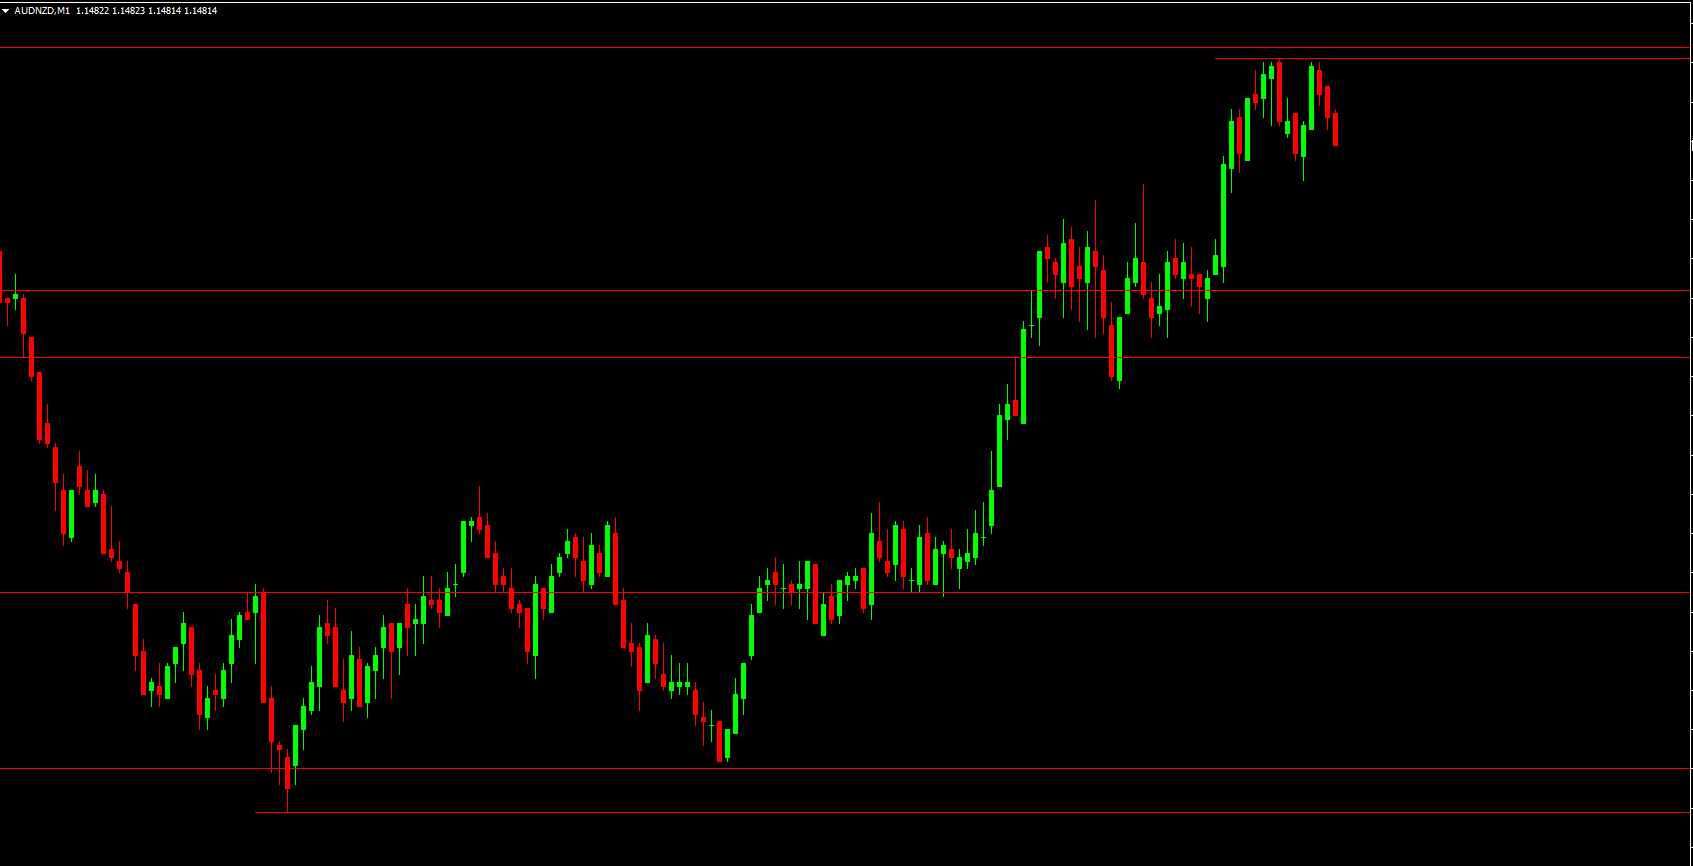
The indicator draws red trend lines on the chart, representing dynamic support and resistance zones. These lines originate from either swing highs or swing lows, helping traders instantly determine which areas may trigger reversals or breakouts.
Common trading approaches include:
Buying at support when price touches a lower trend line, setting stop-loss below the structure.
Selling at resistance when price reacts to the upper trend line.
Trading breakouts, where price breaks through a support or resistance line, signaling Trend Continuation.
Using confluence, combining the indicator with moving averages, Fibonacci levels, RSI, or candlestick patterns to enhance signal accuracy.
Support-resistance trading remains one of the most effective and widely used methods in technical analysis, and this indicator simplifies the process significantly.
Conclusion
The ZZ SR TL Indicator for MT4 is a powerful tool for identifying accurate support and resistance zones based on ZigZag-derived trend lines. Its simplicity and effectiveness make it an excellent choice for traders looking to improve market timing, trend recognition, and overall decision-making.
FAQ
Published:
Dec 08, 2025 10:35 AM
Category: