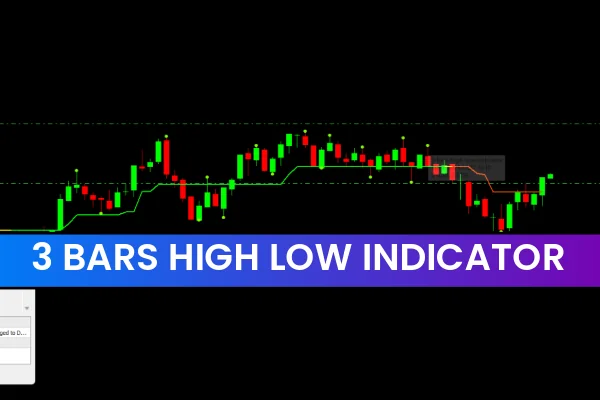
The 3 Bars High Low Indicator for MT4 is a reliable trend-following tool that plots bullish, bearish, and flat market conditions directly on the chart. This indicator is designed to simplify market analysis by visually showing trend direction and generating BUY and SELL signals after confirmed trend changes. Because it does not repaint after candle close, traders receive stable, trustworthy alerts that can be used in manual trading or forex auto trading systems.
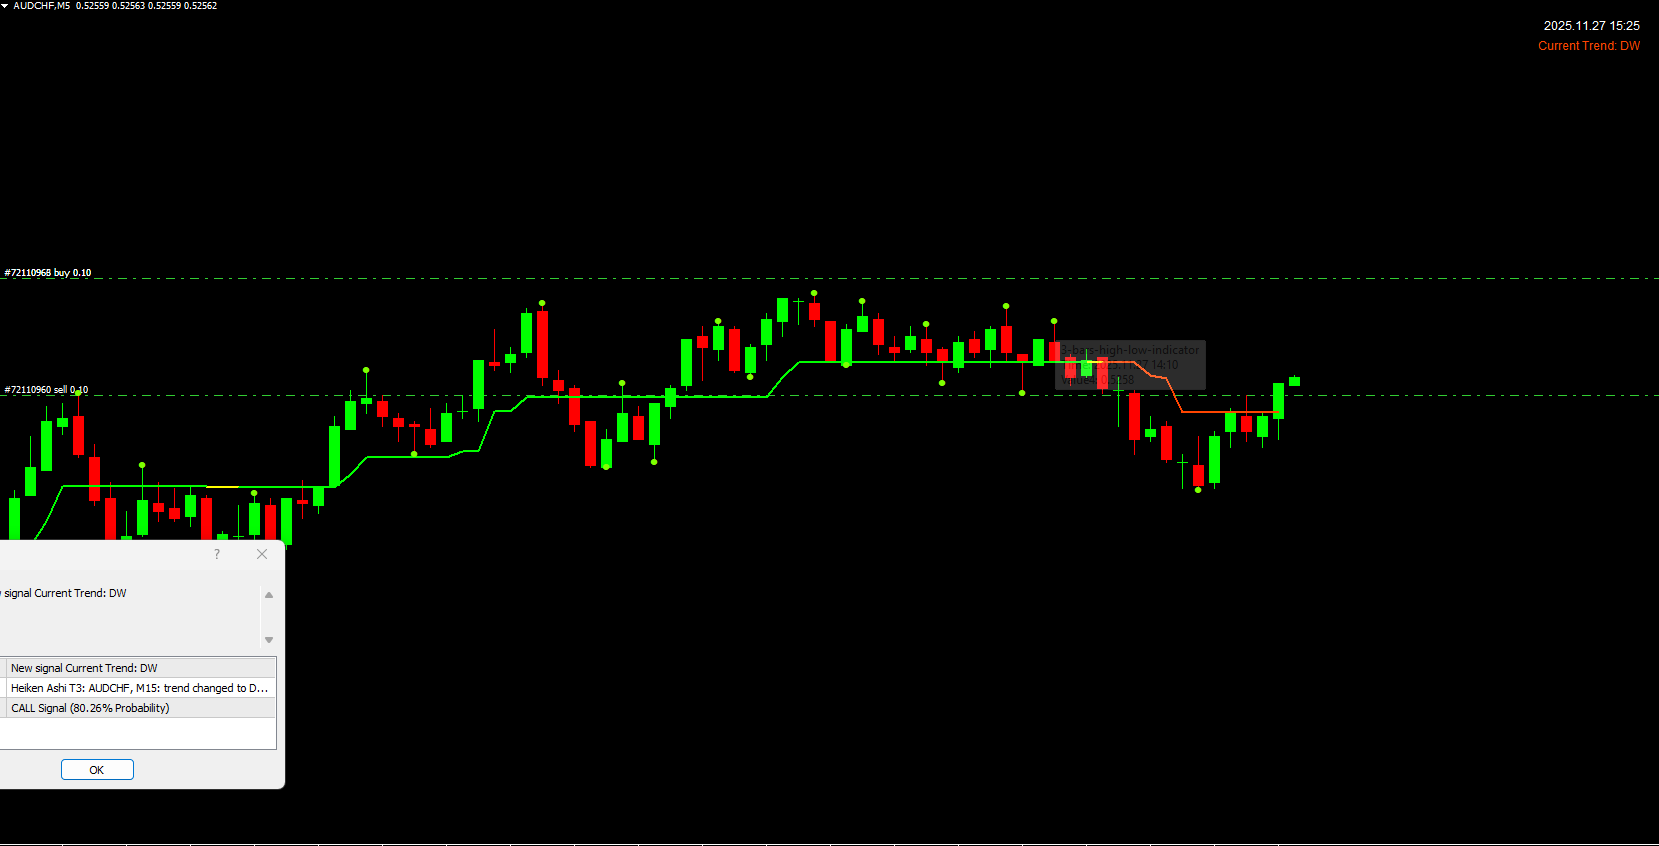
The indicator also displays current trend direction in the upper-right corner of the chart, making it easy to instantly determine whether market momentum is up, down, or neutral.
Features of the 3 Bars High Low Indicator for MT4
Identifies Bullish, Bearish, and Flat Trends
The indicator clearly marks three market phases:
LIME (Bullish trend)
ORANGERED (Bearish trend)
YELLOW (Flat/Neutral trend)
These color-coded trend lines help traders quickly understand Market Structure and plan entries and exits with greater confidence.
Incorporates Fractals for Confirmation
The indicator uses fractals (shown in Chartreuse) to confirm signals. This additional confirmation layer helps traders avoid false entries and ensures that trend shifts are backed by price structure.
Stable, Non-Repainting Signals
Because the indicator does not repaint once a candle closes, the signals remain reliable—making them especially useful for:
Manual trading
Automated trading strategies
Algorithmic trading setups
Backtesting trend-based strategies
How the 3 Bars High Low Indicator Generates Trading Signals
The BUY and SELL signals are created by combining:
CCI (Commodity Channel Index)
ATR (Average True Range)
Fractal structure
The last three bars’ high/low behavior
This combination allows for accurate trend recognition and consistent alerts.
Trading Strategies Using the 3 Bars High Low Indicator
How to Trade Bullish Signals
When the indicator turns LIME, it signals the start of a bullish phase. Traders can open long positions when:
The trend color flips to LIME
Fractals confirm upward movement
Price breaks above previous minor resistance
Recommended approach:
Stop loss: Below the previous swing low
Take profit: When the indicator changes to YELLOW (flat trend)
Alternative exit: When trend flips to ORANGERED (new bearish trend)
This approach helps traders ride the trend while protecting against unexpected reversals.
How to Trade Bearish Signals
When the trend color changes to ORANGERED, the market is entering a bearish phase. Traders can enter short positions using the opposite logic:
Stop loss: Above the previous swing high
Take profit: At the next opposite trend or flat signal
Confirm entries using fractals for added precision
Multi-Timeframe Trading (MTF)
The indicator works effectively on multiple timeframes. Traders often:
Identify the main trend on a higher timeframe
Switch to a lower timeframe to find optimized entries aligned with that trend
By trading in the direction of the higher-timeframe momentum, traders increase their probability of staying on the right side of the market.
Why the 3 Bars High Low Indicator Is Suitable for All Traders
This MT4 indicator is ideal for both new and experienced traders:
Beginners benefit from simple visual trends and straightforward signal alerts.
Advanced traders use the indicator as part of complex systems, algorithmic setups, or auto-trading strategies.
The indicator is also free to download and easy to install, making it accessible to all traders who want a dependable non-repainting trend tool.
Conclusion
The 3 Bars High Low Indicator for MT4 offers clear bullish, bearish, and flat trend signals supported by fractal confirmation. Its non-repainting structure, user-friendly interface, and compatibility with multiple strategies make it a valuable addition to any forex trader’s toolkit. For more high-quality MT4 and MT5 indicators, be sure to visit IndicatorForest.com.
FAQ
The 3 Bars High Low Indicator identifies significant swing highs and lows by analyzing three-bar patterns. It helps traders identify key support and resistance levels based on three-bar formations, providing insights into potential reversal zones and trend continuation points based on these significant price points.
The indicator identifies when three consecutive bars form a significant high or low point. These three-bar highs often act as resistance levels, while three-bar lows often act as support levels. When price breaks above a three-bar high, it may signal bullish continuation. When it breaks below a three-bar low, it may indicate bearish continuation.
Use three-bar highs as potential resistance levels for sell trades and three-bar lows as potential support levels for buy trades. Enter trades when price bounces off these levels with confirmation, or when price breaks through them indicating trend continuation. Always confirm with price action patterns or other technical tools.
Three-bar formations often represent significant swing points where price has made a clear high or low. These levels are more reliable than single-bar extremes because they require confirmation across multiple bars, making them stronger support or resistance levels for trade planning.
The indicator works on all MT4 timeframes and currency pairs, making it suitable for scalping, intraday trading, and swing trading strategies. Three-bar formations are particularly effective on higher timeframes where they represent more significant swing points, though they can also be useful on shorter timeframes.
1 Download
Published:
Dec 14, 2025 13:25 PM
Category: