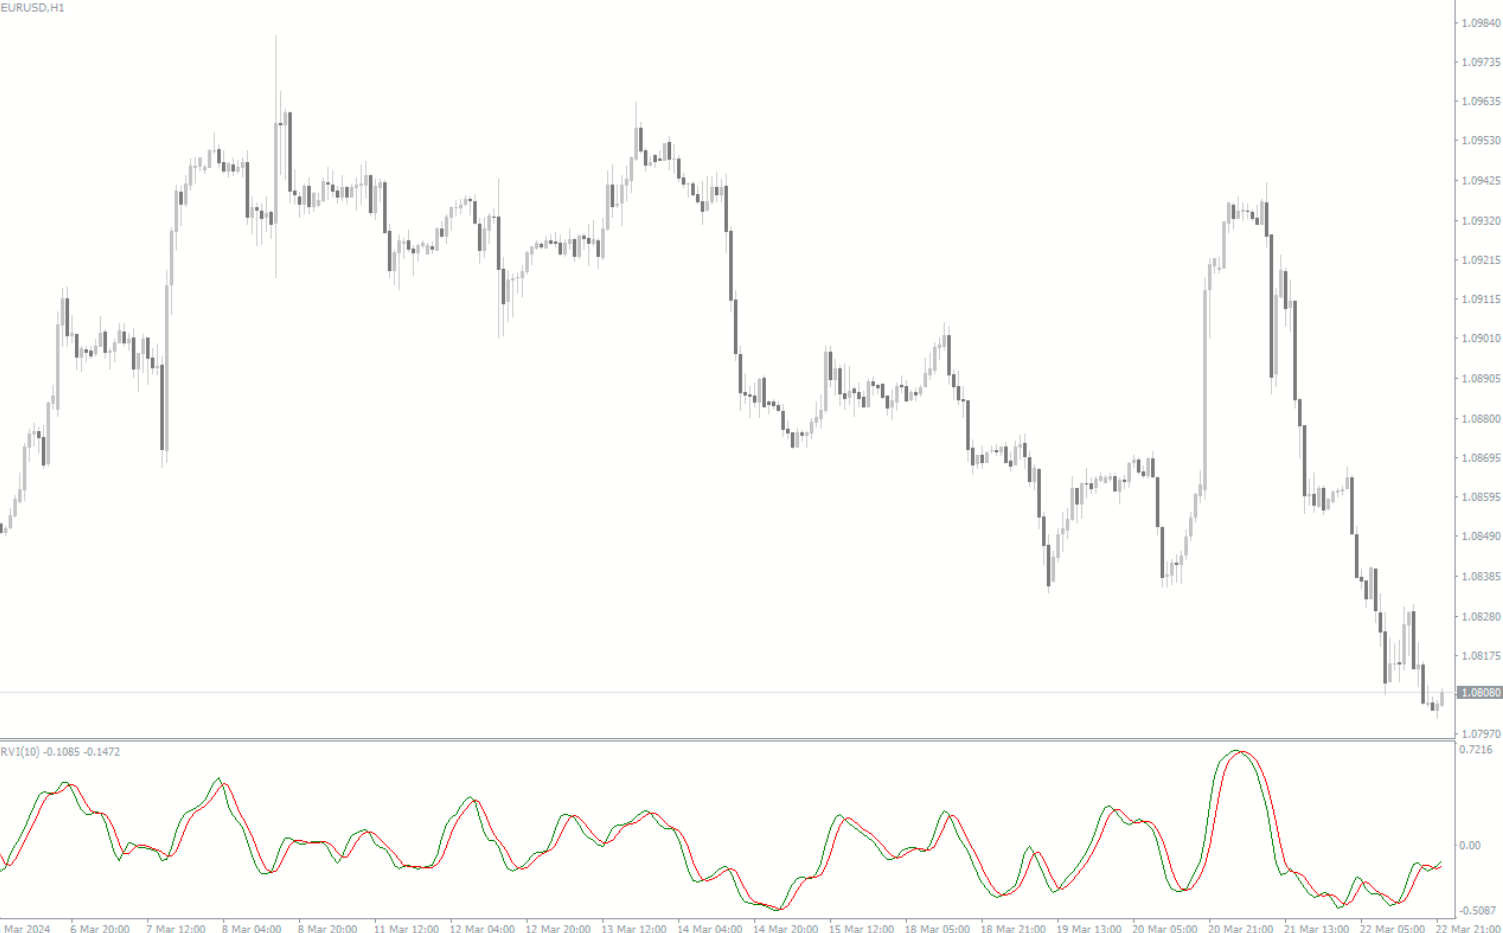
The Relative Vigor Index (RVI) Indicator MT4 is a popular technical tool used by forex traders to measure the strength of market trends. This free indicator helps traders determine whether bullish or bearish momentum is prevailing by comparing the closing price to the opening price over a defined period. By analyzing these values, traders can confirm existing trends and identify potential reversals before they occur.
The RVI indicator is compatible with the MetaTrader 4 platform, making it accessible for both beginner and professional traders who want to gauge market momentum accurately.
What Is the Relative Vigor Index Indicator
The Relative Vigor Index is a momentum oscillator that indicates the strength and direction of a trend. Unlike some indicators that only show price direction, the RVI measures how strongly prices are moving in the trend’s direction. This makes it a valuable confirmation tool alongside other trend-following indicators.
Traders use the RVI to:
Confirm upward or downward trends
Identify potential trend reversals
Measure market momentum
Improve trading accuracy
How the RVI Indicator Works
The Relative Vigor Index compares the closing price to the opening price and smooths the difference using moving averages.
Key Characteristics
Rising RVI indicates an uptrend
Falling RVI signals a downtrend
Crossovers with the signal line may indicate trend reversals
Works on all MT4 timeframes and symbols
By focusing on momentum rather than just price levels, the RVI helps traders make informed decisions about entering or exiting trades.
Using RVI for Trend Confirmation
The Relative Vigor Index Indicator MT4 is particularly effective for trend confirmation.
Uptrend Confirmation
RVI values rising above zero
Price making higher highs
Momentum aligns with the trend direction
Downtrend Confirmation
RVI values falling below zero
Price making lower lows
Strong bearish momentum
Using the RVI in combination with other trend indicators or moving averages improves signal reliability and reduces false entries.
Identifying Potential Trend Reversals
The RVI can also highlight potential market turning points. Divergences between Price Action and RVI signals are key signals for reversals:
Bullish Divergence – Price makes lower lows while RVI rises
Bearish Divergence – Price makes higher highs while RVI falls
Recognizing these patterns can help traders anticipate market shifts and adjust their strategies accordingly.
Best Trading Strategies Using RVI
The RVI indicator can be integrated into multiple trading approaches:
Trend-Following Strategy
Trade in the direction of RVI momentum
Enter when RVI confirms trend with price action
Exit on opposite RVI signal or trend weakening
Reversal Strategy
Watch for divergences between RVI and price
Combine with Support And Resistance levels
Confirm with candlestick patterns or other momentum indicators
These strategies allow traders to adapt the RVI for both short-term and long-term trading.
Advantages of Relative Vigor Index Indicator MT4
Free and easy to use
Confirms trends and identifies reversals
Works across multiple timeframes
Enhances market momentum analysis
Suitable for both beginners and professionals
Its ability to measure Trend Strength makes it a valuable addition to any trader’s toolkit.
Conclusion
The Relative Vigor Index (RVI) Indicator MT4 is a versatile and practical tool for forex traders seeking to measure market momentum and confirm trends. By combining RVI signals with other technical analysis tools, traders can improve decision-making, spot potential reversals, and enhance overall trading performance.
👉 Visit IndicatorForest.com to explore more free MT4 indicators, advanced trading tools, and expert guides to boost your forex trading results.
FAQ
MTF RVI (Multi-Timeframe Relative Vigor Index) displays RVI values from multiple timeframes simultaneously. RVI measures the strength of a trend by comparing closing prices to the trading range, helping identify trend momentum across different timeframes.
By comparing RVI across timeframes, you can confirm lower timeframe signals with higher timeframe momentum, avoid trading against the dominant trend, identify stronger setups, and reduce false signals through timeframe alignment.
RVI above zero indicates bullish momentum, RVI below zero suggests bearish momentum, rising RVI shows strengthening trend, and falling RVI indicates weakening trend. Alignment across timeframes strengthens signals.
Use it for trend confirmation before entering trades, momentum filtering to avoid weak setups, multi-timeframe alignment strategies, and reversal detection when RVI diverges across timeframes.
Combine with moving averages for trend direction, support and resistance levels for entry timing, price action patterns for confirmation, and other momentum indicators like RSI or MACD for stronger signals.
Published:
Dec 17, 2025 11:38 AM
Category: