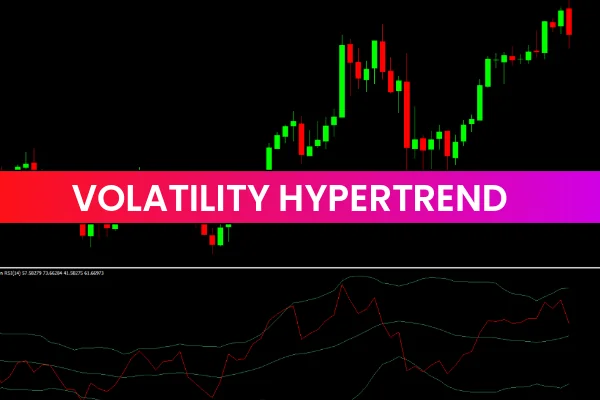
The Volatility Hypertrend Indicator for MT4 is a powerful ATR-based forex trading tool that helps traders identify volatility, market trends, and entry or exit opportunities with precision. This indicator plots buy and sell arrows directly on the chart and provides instant alerts, making it highly suitable for both beginner and experienced traders.
Designed for MetaTrader 4 (MT4), this indicator interprets volatility using the Average True Range (ATR)—a proven technical measure that reflects the strength and intensity of price movement. As a result, traders can easily recognize bullish and bearish trends, determine optimal trade timing, and improve overall strategy performance.
How the Volatility Hypertrend Indicator for MT4 Works
The Volatility Hypertrend Indicator calculates the current market volatility using ATR and translates that data into actionable buy or sell signals.
Bullish Signals: The indicator draws blue up arrows when the volatility indicates a potential upward trend.
Bearish Signals: Conversely, red down arrows appear when bearish momentum dominates the market.
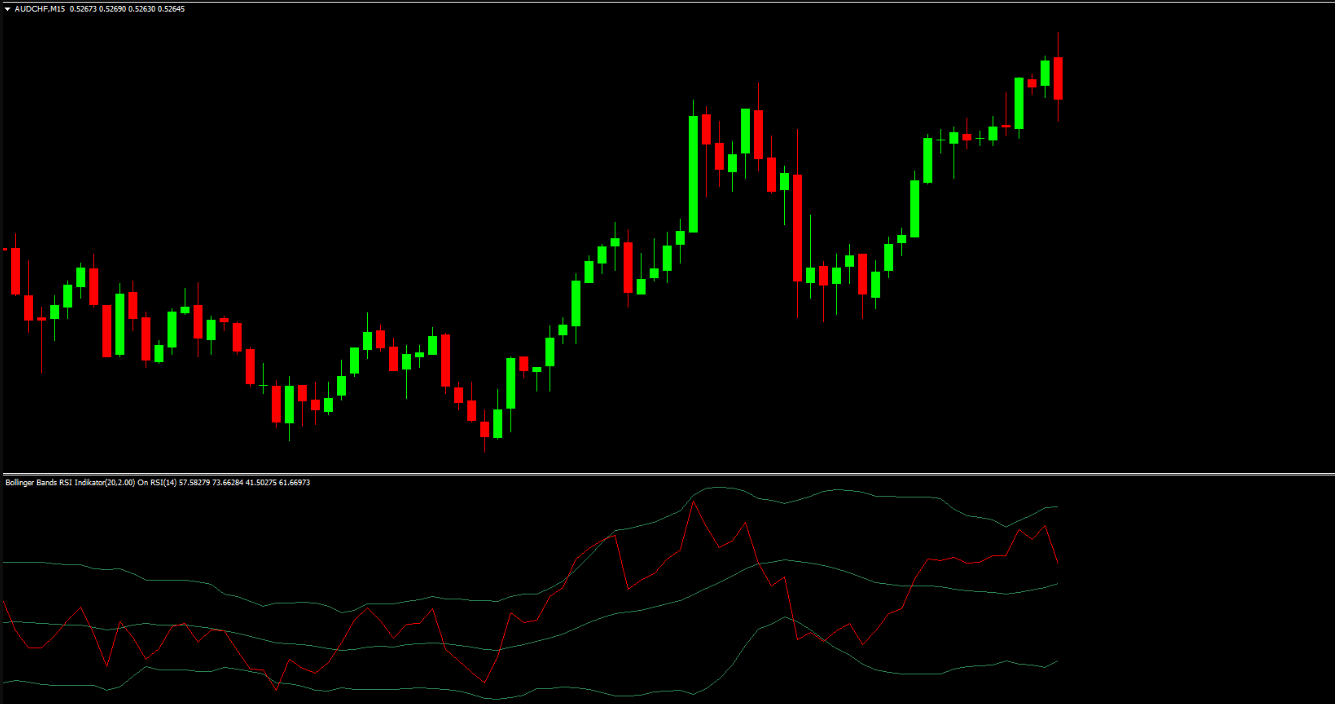
In a separate indicator window, the tool displays a green reference line and a dual-color signal line. The trading logic is based on the crossover between these lines.
When the signal line crosses above the reference line, a buy signal is generated.
When it crosses below, a sell signal appears.
This clear visual presentation allows traders to identify trend direction quickly and act accordingly.
Volatility Hypertrend Indicator Trading Strategy
Using the Volatility Hypertrend Indicator MT4 can simplify your trading decision-making process. Below is a simple yet effective trading approach:
Buy Entry Rules
Wait for a blue up arrow to appear.
Confirm that the signal line is above the reference line.
Place a buy order and set a stop loss just below the previous swing low.
Sell Entry Rules
Wait for a red down arrow to appear.
Confirm that the signal line is below the reference line.
Place a sell order and set a stop loss above the previous swing high.
Since the indicator doesn’t repaint after candle close, signals remain reliable and trustworthy. Traders can confidently use it on any timeframe, from Scalping on M1 charts to long-term trading on daily charts.
Exit Strategy and Risk Management
The Volatility Hypertrend Indicator for MT4 does not specify a fixed profit target, giving traders flexibility. Common exit methods include:
Closing trades upon the opposite Arrow Signal.
Setting custom take-profit based on a risk-reward ratio (e.g., 1:2 or 1:3).
Using trailing stops to maximize profit potential.
This approach ensures traders can adapt the indicator to their unique style—scalping, intraday, or swing trading.
Why Choose the Volatility Hypertrend Indicator for MT4?
The Volatility Hypertrend Indicator offers several advantages:
Non-repainting signals for reliable analysis.
Works on all timeframes and currency pairs.
ATR-based logic for accuracy during volatile market conditions.
Visual arrows and alerts for fast decision-making.
User-friendly interface suitable for both new and professional traders.
Its simplicity, accuracy, and compatibility make it a must-have tool in any forex trader’s arsenal.
Conclusion
In conclusion, the Volatility Hypertrend Indicator for MT4 is an ATR-driven volatility and Trend Indicator that produces highly accurate buy and sell signals using colored arrows and alert notifications. Whether you’re a scalper, intraday trader, or long-term investor, this tool can help you identify trend reversals, manage risk, and enhance profitability.
To explore more free and premium MT4 & MT5 indicators, visit IndicatorForest.com — your trusted source for professional trading tools.
FAQ
Published:
Dec 21, 2025 23:14 PM
Category: