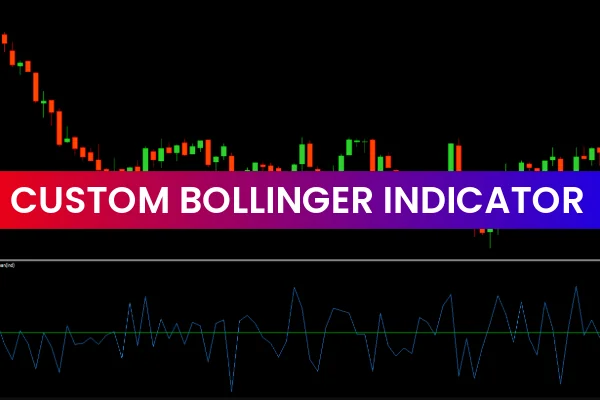
The Custom Bollinger Indicator for MT4 is an advanced technical analysis tool that enhances the traditional Bollinger Bands to provide clearer insights into market volatility, trend direction, and potential breakout points. By customizing parameters and visual settings, this indicator allows traders to adapt it to their trading style, making it a versatile tool for Forex, commodities, indices, and cryptocurrency markets.
Whether you are a beginner or an experienced trader, the Custom Bollinger Indicator helps you interpret price movements more effectively, detect overbought or oversold conditions, and plan trades with improved timing.
How the Custom Bollinger Indicator Works
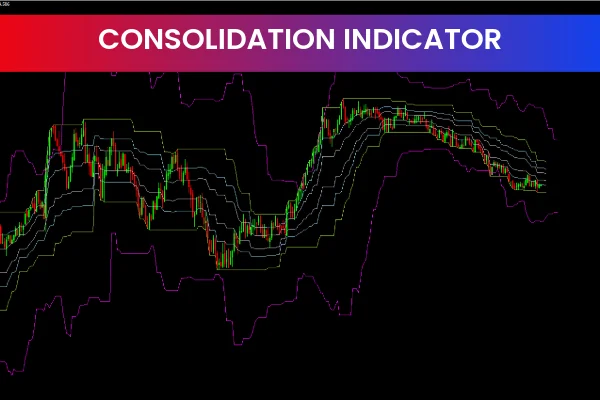
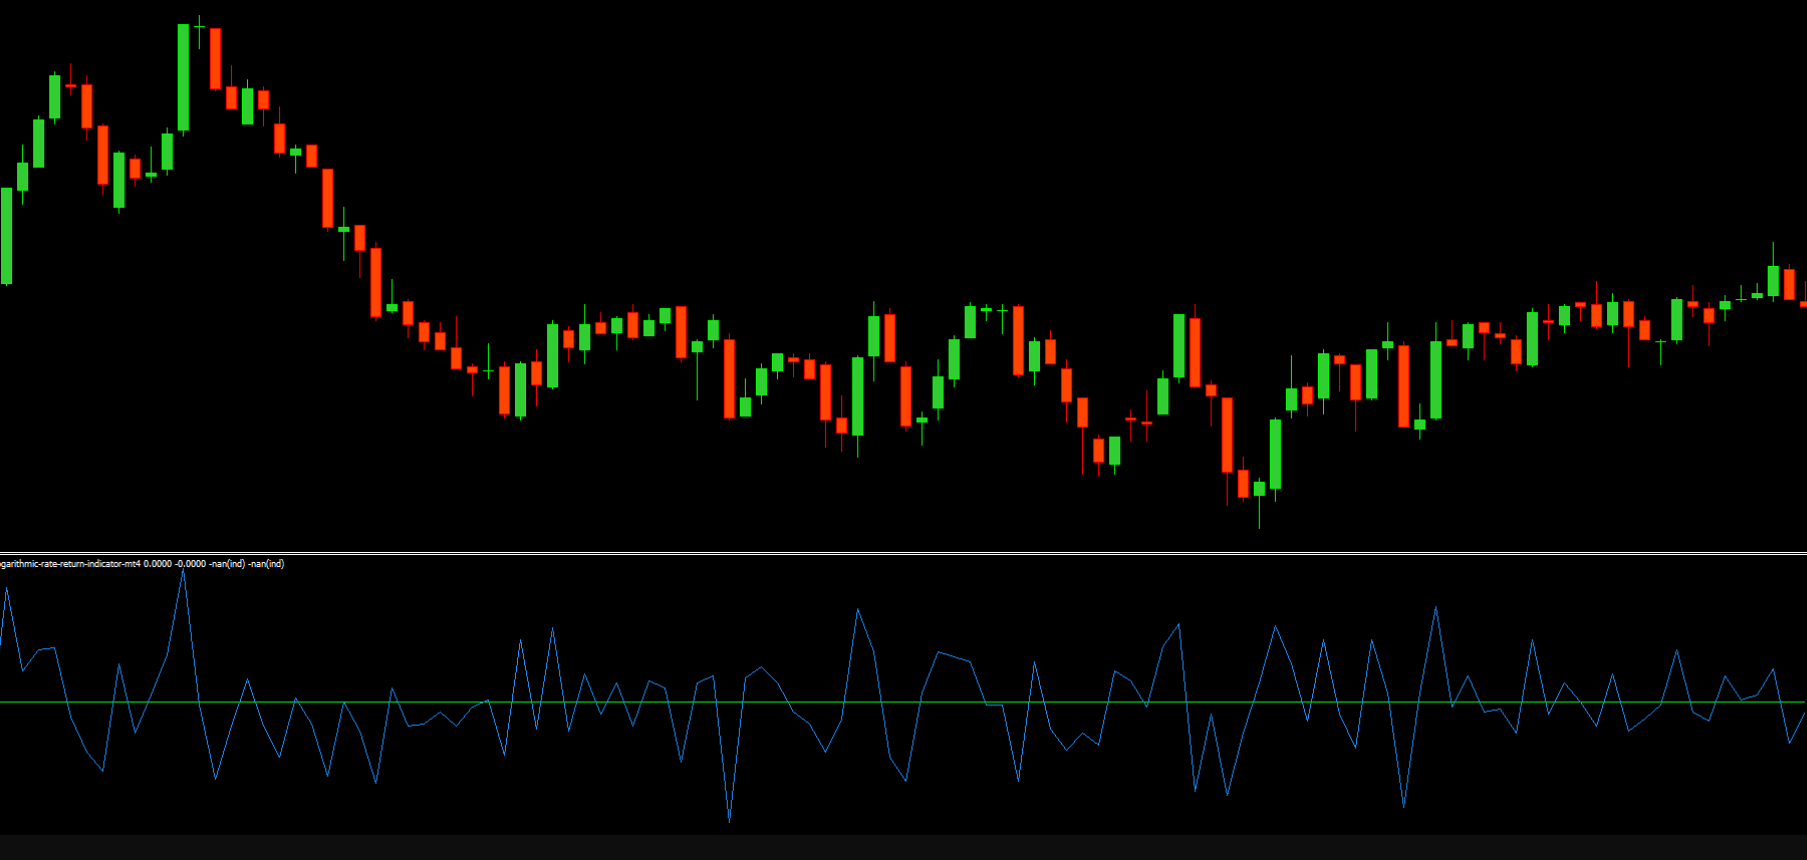
The Custom Bollinger Indicator is based on the standard Bollinger Bands principle, which consists of a central moving average with upper and lower bands calculated using standard deviation. The customization allows traders to:
Adjust the period of the moving average to suit different timeframes.
Modify the band deviation to reflect varying market volatility.
Change colors and visual styles to improve clarity and readability on MT4 charts.
When price touches or moves beyond the upper band, the market may be considered overbought, signaling a potential sell opportunity. Conversely, when price touches or moves below the lower band, the market may be oversold, indicating a potential buy setup.
Key Features and Benefits
Enhanced Volatility Analysis
The indicator adapts to changing market conditions, allowing traders to see real-time shifts in volatility.
Customizable Settings
Modify moving average periods, standard deviation, and colors to fit your trading strategy and visual preferences.
Trend Identification
Quickly determine the direction of the trend by observing price interaction with the central moving average and band expansions.
Early Breakout Signals
Identify potential breakouts when price moves strongly beyond the upper or lower bands, improving entry and exit timing.
Multi-Timeframe Support
Effective on all MT4 timeframes, making it suitable for Scalping, day trading, and swing trading.
Practical Trading Applications
The Custom Bollinger Indicator can be used alone or combined with other tools for improved accuracy:
Trend Following
Observe the price’s relation to the central moving average to confirm the prevailing trend before placing trades.
Overbought and Oversold Conditions
Use upper and lower bands to spot extreme price conditions and potential reversal points.
Breakout Trading
Detect breakout opportunities when price moves sharply beyond the bands, indicating momentum continuation.
Combine With Other Indicators
Enhance signals by pairing with RSI, MACD, or volume-based tools to validate entries and exits.
By applying these strategies, traders can increase trade precision, manage risk more effectively, and capitalize on market movements.
Why Traders Prefer the Custom Bollinger Indicator
Traders choose the Custom Bollinger Indicator for its flexibility, visual clarity, and ability to adapt to different market conditions. Its combination of customization options and standard Bollinger Band methodology makes it a reliable tool for analyzing volatility, confirming trends, and identifying high-probability setups.
Conclusion
The Custom Bollinger Indicator for MT4 is an essential tool for traders seeking a versatile and customizable way to analyze volatility, trends, and potential breakout opportunities. Its adjustable settings, clear visual design, and multi-timeframe compatibility make it suitable for all levels of traders.
👉 Download the Custom Bollinger Indicator today from IndicatorForest.com and elevate your trading strategy with professional-grade analysis tools.
FAQ
Published:
Dec 09, 2025 01:27 AM
Category: