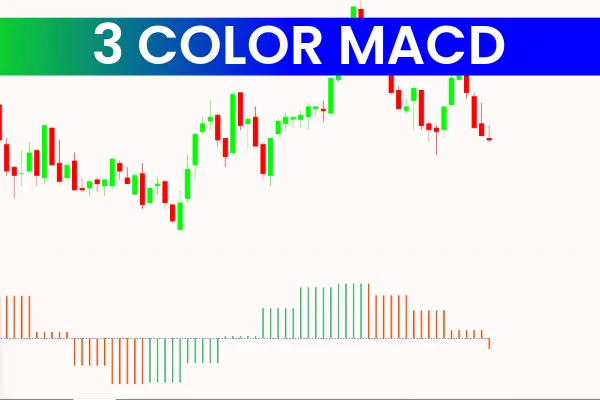
The 3 Color MACD Indicator is a highly popular technical analysis tool for traders using the MetaTrader 4 (MT4) platform. It enhances the standard Moving Average Convergence Divergence (MACD) indicator by providing a visually intuitive representation of market momentum, making it easier to spot potential trend changes.
Features of the 3 Color MACD Indicator
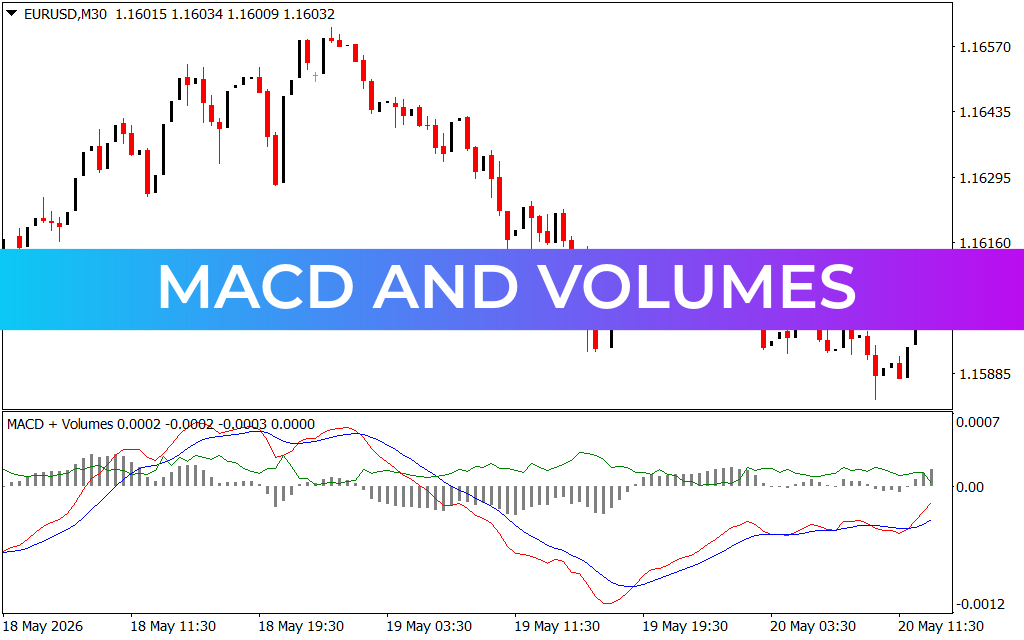
The core strength of this indicator lies in its ability to display the intersection of the MACD signal line and the MACD histogram simultaneously. The histogram is color-coded to indicate market conditions, with blue representing the overall trend direction.
Key functionalities include:
Buy Signals: When the MACD signal line crosses the zero line upward, the indicator alerts traders to a potential bullish scenario.
Sell Signals: When the signal line crosses downward below the zero line, it indicates a bearish market environment.
Visual Momentum Analysis: The color-coded histogram allows traders to quickly assess momentum and Trend Strength.
Benefits of Using the 3 Color MACD Indicator
Accurate Trend Identification: Quickly determine the market’s trend and potential reversals.
Enhanced Entry and Exit Points: Use the indicator to pinpoint optimal trading opportunities for buy or sell positions.
User-Friendly Interface: Its visual cues make it easy for both beginners and experienced traders to interpret signals.
Integration with Trading Strategy: The indicator complements other technical tools to improve decision-making and reduce false signals.
How to Maximize the 3 Color MACD Indicator
For best results, combine the 3 Color MACD with support/resistance levels or other oscillators like RSI for confirmation. Monitor color changes and zero-line crossings to anticipate momentum shifts, ensuring timely entries and exits in your trades.
Visit IndicatorForest.com to explore the 3 Color MACD Indicator along with other advanced Forex indicators. Our detailed guides and tutorials help traders of all levels enhance their strategies and trade with confidence.
FAQ
The 3 Color MACD Indicator enhances the standard MACD by providing a visually intuitive representation of market momentum through color-coded histograms. The histogram is color-coded to indicate market conditions, with blue representing the overall trend direction, making it easier to spot potential trend changes compared to traditional MACD line analysis.
Buy signals occur when the MACD signal line crosses the zero line upward, alerting traders to a potential bullish scenario. Sell signals occur when the signal line crosses downward below the zero line, indicating a bearish market environment. The color-coded histogram allows traders to quickly assess momentum and trend strength visually.
The histogram displays the intersection of the MACD signal line and the MACD histogram simultaneously, with colors indicating market conditions. Blue typically represents the overall trend direction, while other colors may indicate momentum changes. Monitor color changes and zero-line crossings to anticipate momentum shifts and ensure timely entries and exits in your trades.
For best results, combine the 3 Color MACD with support/resistance levels or other oscillators like RSI for confirmation. The visual cues make it easy for both beginners and experienced traders to interpret signals, helping quickly determine the market's trend and potential reversals for accurate trend identification.
The indicator provides accurate trend identification, helping traders quickly determine the market's trend and potential reversals. It enhances entry and exit points by pinpointing optimal trading opportunities for buy or sell positions. The user-friendly interface with visual cues makes it easy to interpret, and it complements other technical tools to improve decision-making and reduce false signals.
4 Downloads
Published:
Dec 15, 2025 22:51 PM
Category: