Navigating Market Trends with the 4 Time Frame Indicator
In technical analysis, one of the most significant pitfalls for traders is "tunnel vision"—focusing so intensely on a single timeframe that they lose sight of the broader market context. A trade that looks like a perfect buy on a 1-minute chart might actually be a dangerous move against a powerful downtrend on the hourly chart. The 4 Time Frame indicator is a professional-grade solution designed to eliminate this blind spot by providing a real-time "heatmap" of trend alignment across multiple horizons simultaneously.
The Power of Multi-Timeframe Alignment
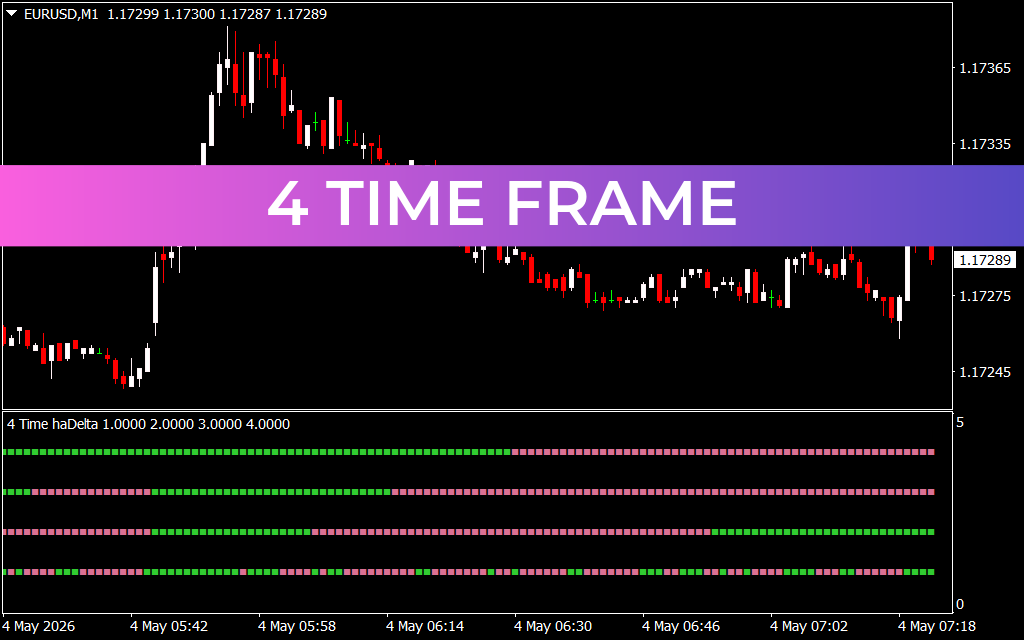
The 4 Time Frame indicator utilizes a clean, dashboard-style interface located in a sub-window beneath your price chart. It tracks the trend across four distinct periods, typically ranging from short-term Scalping timeframes to long-term trend horizons.
- Green Squares (Bullish Alignment): When a specific row is green, it signifies that the momentum on that timeframe is upward.
- Pink/Red Squares (Bearish Alignment): When a row is pink, it indicates that the momentum on that timeframe is downward.
The "Holy Grail" for many trend followers is confluence. When all four rows align with the same color, it suggests a powerful, unified market move where institutional "big money" and short-term retail traders are moving in the same direction.
Enhancing Precision on the M1 Chart
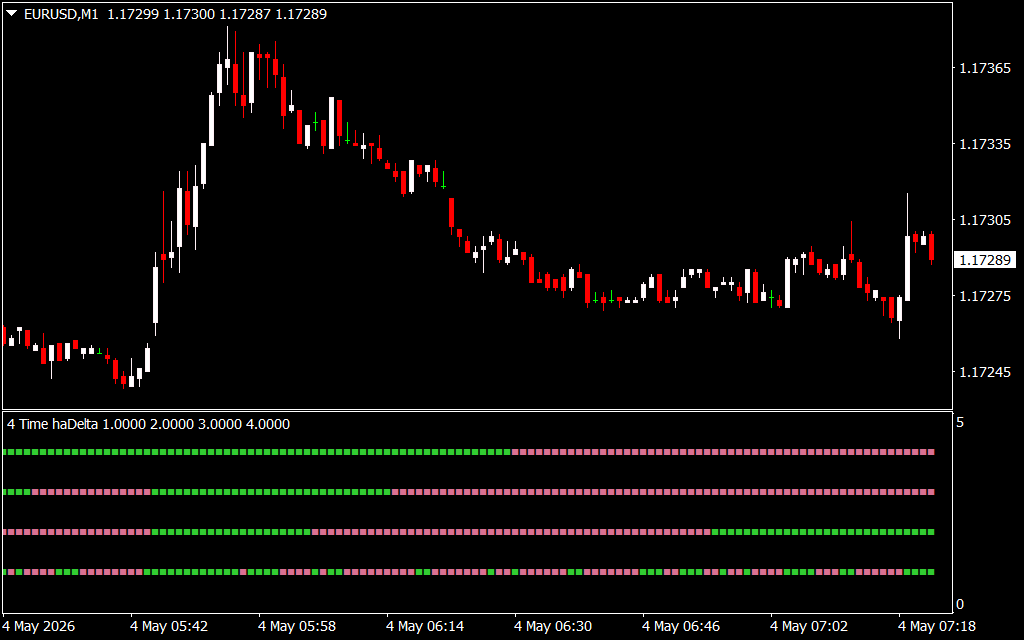
As demonstrated in the EURUSD M1 chart, the 4 Time Frame indicator acts as a vital filter for high-frequency trading. Scalping on the 1-minute chart is notoriously difficult due to market noise. However, by using this dashboard, a trader can wait for the moments where the M1 momentum matches the M5, M15, and H1 trends.
Notice in the chart how the indicator transition from solid green to a mixed signal preceded the eventual price stagnation. By visualizing these shifts early, traders can avoid entering "late" into a trend that is already losing steam on higher timeframes. It provides the objective discipline needed to stay on the right side of the market velocity.
Strategic Implementation and Risk Management
The 4 Time Frame indicator is not just an entry tool; it is a comprehensive risk management assistant.
- Entry Filtering: Only take "Buy" signals when at least three out of four timeframes are green. This ensures you aren't fighting a macro trend.
- Early Exit Warning: If you are in a long position and the top two rows (the fastest timeframes) flip from green to pink, it may be an early signal to tighten your stop-loss or take partial profits.
- Volatility Assessment: When the dashboard shows a "checkerboard" pattern of mixed colors, it indicates a ranging or consolidating market. This is a clear signal to stand aside and wait for a clearer directional bias.
By distilling complex multi-chart analysis into a single, intuitive dashboard, the 4 Time Frame indicator empowers traders to trade with the perspective of a pro. It removes the guesswork and provides a structural framework for understanding exactly who is in control of the market at any given moment.
3 Downloads
Last Update:
May 04, 2026 10:24 AM
Published:
Jan 28, 2026 17:29 PM
Category: