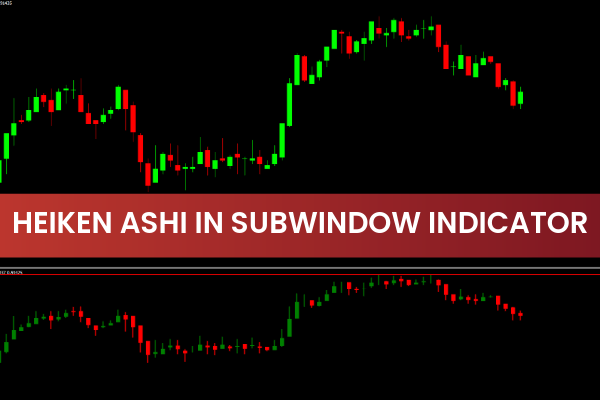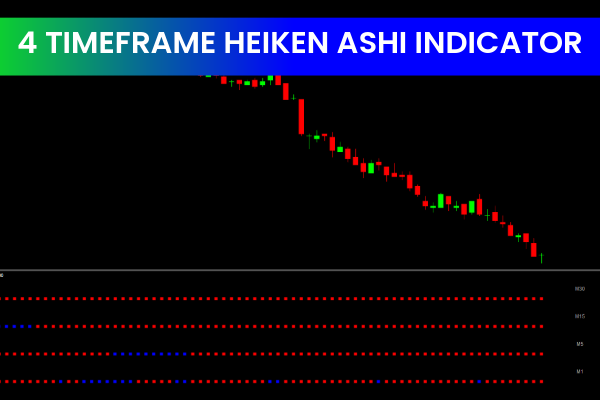
The 4 Timeframe Heiken Ashi Indicator for MT4 is a powerful trend-tracking tool that automatically displays trend direction across four different timeframes. Using blue and red squares, the indicator visually identifies whether the market is in an uptrend or downtrend. Blue squares confirm bullish momentum, while red squares highlight bearish pressure. By showing higher-timeframe conditions directly on your chart, the indicator becomes an excellent addition to nearly any forex trading strategy.
What Is the 4 Timeframe Heiken Ashi Indicator?
This MT4 indicator simplifies multi-timeframe analysis by automatically inserting higher timeframes above your current chart. Traders can instantly see how the market is behaving on the H1, H4, Daily, and Weekly charts without switching windows. This allows forex traders to make more informed decisions and avoid trading against the dominant trend.
The indicator works smoothly inside MetaTrader 4, MetaTrader 5 (via converters), and is useful for algorithmic trading, algo systems, backtesting software, and manual forex strategies. It provides a clean visual layout that helps traders understand market consistency and Trend Strength in real time.
Why Multi-Timeframe Trend Data Matters
Helps traders avoid false entries
Confirms Market Structure across several timeframes
Supports swing trading and intraday strategies
Provides a clear picture of overall market direction
Enhances expert advisor performance when combined with filters
How to Use the 4 Timeframe Heiken Ashi Indicator for MT4
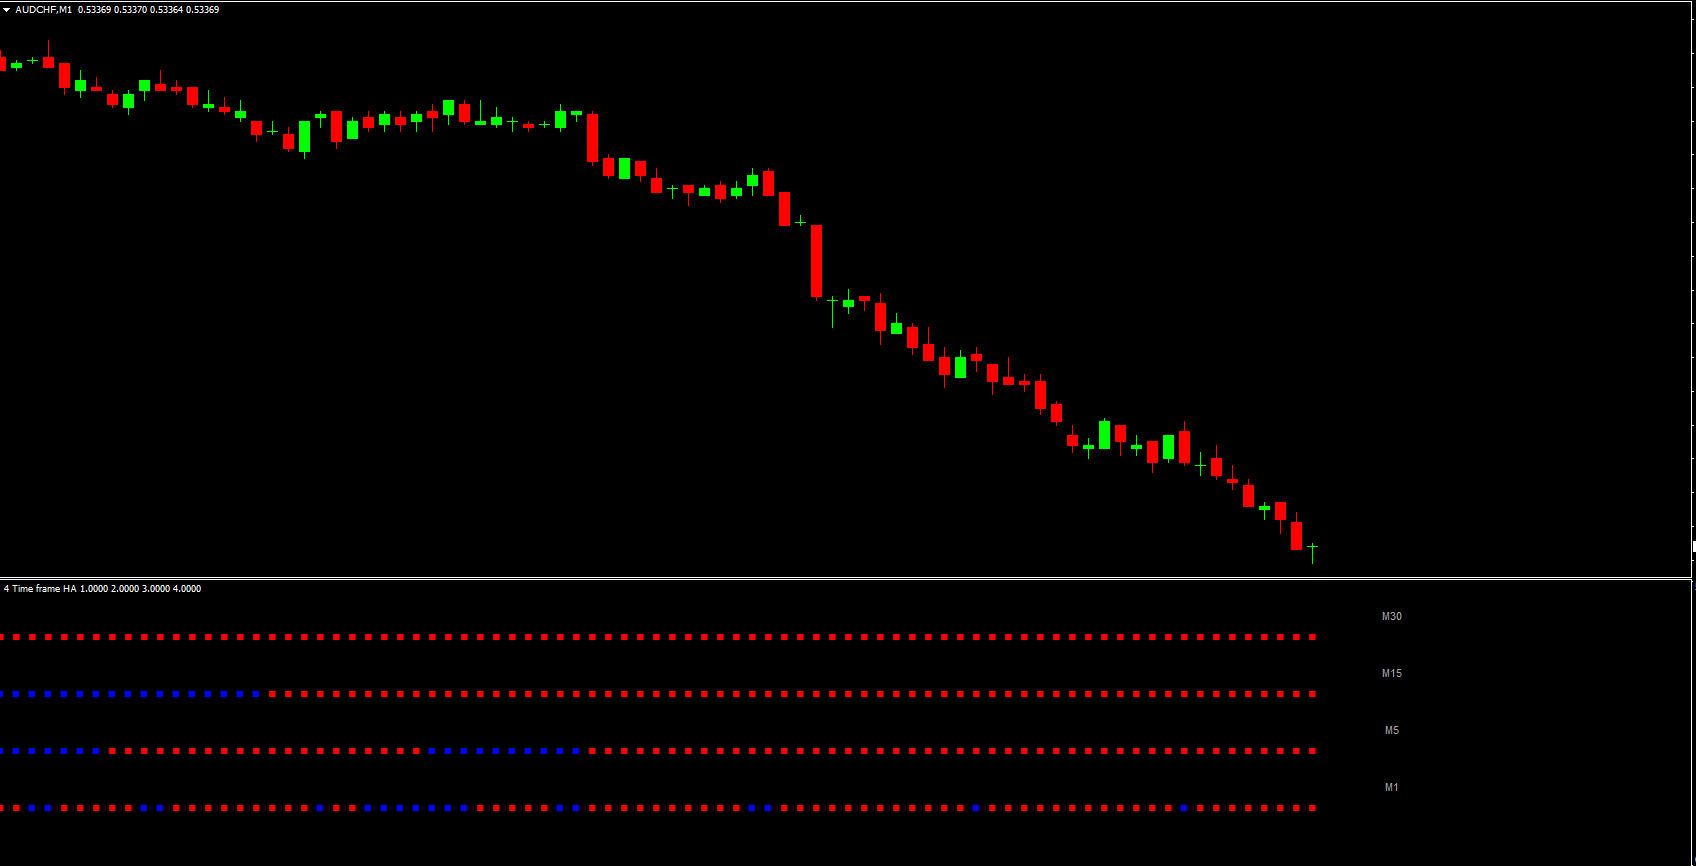
The H1 GBPUSD example chart shows how the indicator plots trend strength using colored squares. The top row represents the current timeframe, while each lower row corresponds to a progressively higher timeframe. For example, if the active chart is H1, the subsequent rows will display H4, Daily, and Weekly trend conditions.
This structure makes it easy to identify when the market trends align across all major timeframes—an essential part of any professional trading strategy.
Interpreting Trend Squares
Blue squares: Uptrend confirmed
Red squares: Downtrend confirmed
While the indicator does not generate BUY or SELL signals directly, it highlights trend direction clearly. Traders can combine Heiken Ashi multi-timeframe trend data with additional indicators such as RSI, MACD, or moving averages to refine entry and exit points.
Suggested Trading Approach
Identify the trend on higher timeframes (Daily/Weekly).
Look for alignment across all four timeframes.
Enter BUY trades when all or most squares turn blue.
Enter SELL trades when all or most squares turn red.
Use oscillators or price-action signals to confirm entry timing.
Using the indicator this way helps reduce noise and improves the probability of entering trades in the direction of the major trend.
Benefits of Using the 4 Timeframe Heiken Ashi Indicator
Supports any trading strategy
Works on every currency pair
Ideal for trend traders and swing traders
Helps filter weak or choppy markets
Enhances consistency in algorithmic trading systems
Conclusion
The 4 Timeframe Heiken Ashi Indicator for MT4 offers a simple yet powerful way to track trend strength across multiple timeframes. By plotting red and blue squares for the current and higher timeframes, it provides traders with clear directional insight. Although it does not generate direct trade entries, combining it with tools like RSI or MACD can create a strong, reliable strategy.
You can download the indicator for free at IndicatorForest.com, where many more MT4 and MT5 trading tools are available.
FAQ
2 Downloads
Published:
Dec 10, 2025 08:23 AM
Category: