In the fast-paced world of Forex trading, identifying market trends quickly can give traders a significant advantage. The MTF ZigZag Indicator is a free, versatile tool for MetaTrader 4 (MT4) that helps traders visualize Price Action, detect market turning points, and make more informed trading decisions.
Understanding the MTF ZigZag Indicator
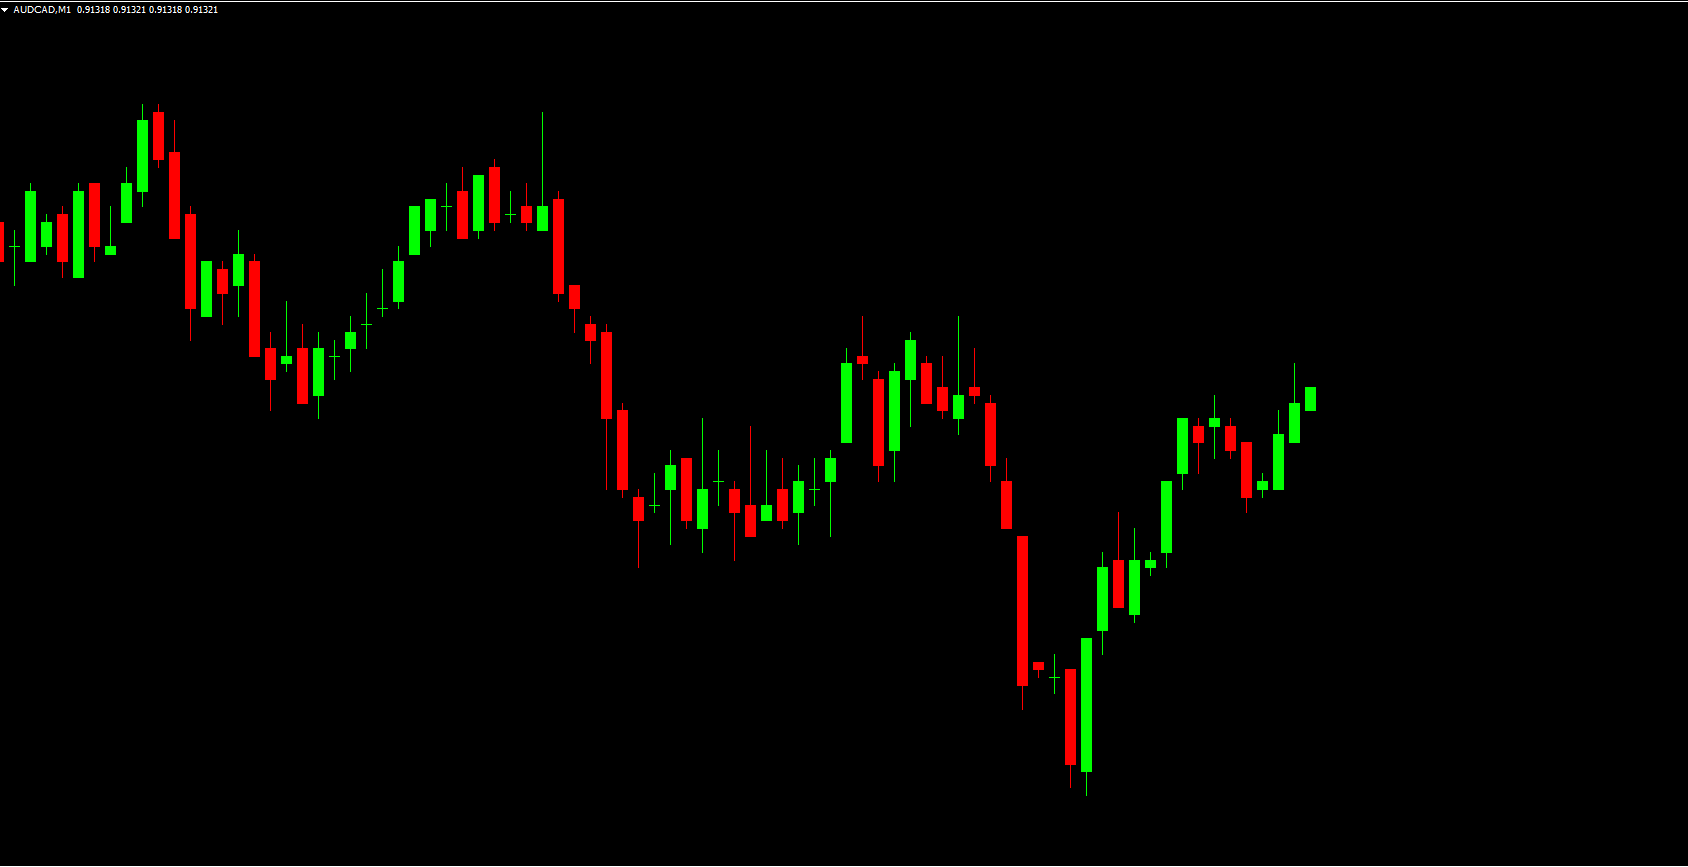
The indicator works by tracking the highs and lows of price movements. It plots a series of dots on the chart and connects them with a red line, forming a clear zig-zag pattern. This pattern highlights potential Support And Resistance levels and allows traders to identify emerging bullish or bearish trends.
Key Features of the MTF ZigZag Indicator
Highs and Lows Detection: Automatically identifies key turning points in the market.
Zig-Zag Visualization: Connects points with lines to clearly show market direction.
Support and Resistance Identification: Helps locate critical levels for trade planning.
Multi-Timeframe Analysis: Works across different timeframes for Scalping, day trading, or swing trading.
User-Friendly Interface: Easy to read and interpret for both beginner and advanced traders.
Benefits of Using the MTF ZigZag Indicator
Trend Identification: Quickly determine whether the market is trending bullish or bearish.
Improved Trade Timing: Pinpoint potential entry and exit points based on market turning points.
Visual Clarity: Zig-zag lines provide a clear picture of Market Structure and movement.
Versatile Strategy Support: Useful for scalping, intraday, and swing trading strategies.
How to Use the MTF ZigZag Indicator Effectively
Combine the MTF ZigZag Indicator with other technical tools such as moving averages, oscillators, or support/resistance levels to confirm trends and reduce false signals. Use the visual zig-zag patterns to manage trades, set stop-losses, and optimize take-profit levels.
Download the MTF ZigZag Indicator from IndicatorForest.com to enhance your Forex trading strategy and confidently navigate market highs and lows.
FAQ
The MTF ZigZag Indicator tracks the highs and lows of price movements, plotting a series of dots on the chart and connecting them with a red line to form a clear zig-zag pattern. This pattern highlights potential support and resistance levels and allows traders to identify emerging bullish or bearish trends.
By connecting key turning points (highs and lows) with lines, the ZigZag pattern automatically identifies significant support and resistance levels. These levels are critical for trade planning, as price often reacts at these points, making them useful for setting entry, exit, and stop-loss levels.
The indicator works across different timeframes for scalping, day trading, or swing trading. This multi-timeframe capability allows traders to see the broader market trend on higher timeframes while identifying precise entry points on lower timeframes, improving overall trade accuracy.
Use the visual zig-zag patterns to manage trades, set stop-losses, and optimize take-profit levels. Combine the MTF ZigZag Indicator with other technical tools such as moving averages, oscillators, or support/resistance levels to confirm trends and reduce false signals. The pattern helps pinpoint potential entry and exit points based on market turning points.
Yes, the indicator has a user-friendly interface that is easy to read and interpret for both beginner and advanced traders. The clear zig-zag visualization provides a straightforward picture of market structure and movement, making it accessible for traders learning to identify trends and turning points.
2 Downloads
Published:
Dec 16, 2025 01:37 AM
Category: