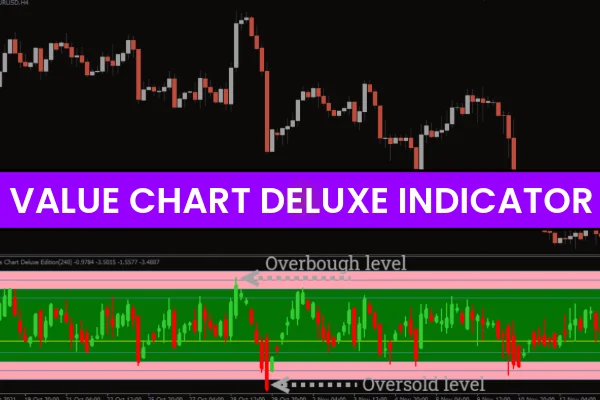
The Value Chart Deluxe Indicator for MT4 is a powerful market analysis tool used to identify continuous market cycles, reversal zones, and BUY/SELL setups. By analyzing the highs and lows of Price Action, this indicator reveals where true market value lies. Traders use it to detect overbought/oversold levels, support/resistance zones, and potential divergences. Because of its clarity and simplicity, the Value Chart Deluxe Indicator for MT4 is ideal for both beginners and advanced traders.
How the Value Chart Deluxe Indicator for MT4 Works
The Value Chart Deluxe tool processes current market conditions and compares them with previously accumulated data. This gives traders a visual representation of major turning points. It highlights when the market is overstretched in either direction and therefore more likely to reverse.
Unlike regular oscillators, this indicator focuses heavily on market value zones rather than just momentum. This provides more reliable and steady insights into likely price movements. Traders can view market cycles clearly and anticipate when price is entering an extreme zone.
Benefits of Using the Value Chart Deluxe Indicator
The Value Chart Deluxe Indicator offers several advantages:
Identifies BUY/SELL Zones: Helps determine when price reaches oversold or overbought levels.
Detects Reversal Points: Useful for spotting potential turning points before the market shifts.
Reveals Support/Resistance: Supports zone-based trading by highlighting market value extremes.
Shows Divergence: Helps confirm trend exhaustion and reversal opportunities.
Works for All Traders: Suitable for beginners and professionals looking for additional confirmation.
These benefits make the indicator a solid addition to any existing trading strategy.
How to Trade With the Value Chart Deluxe Indicator for MT4
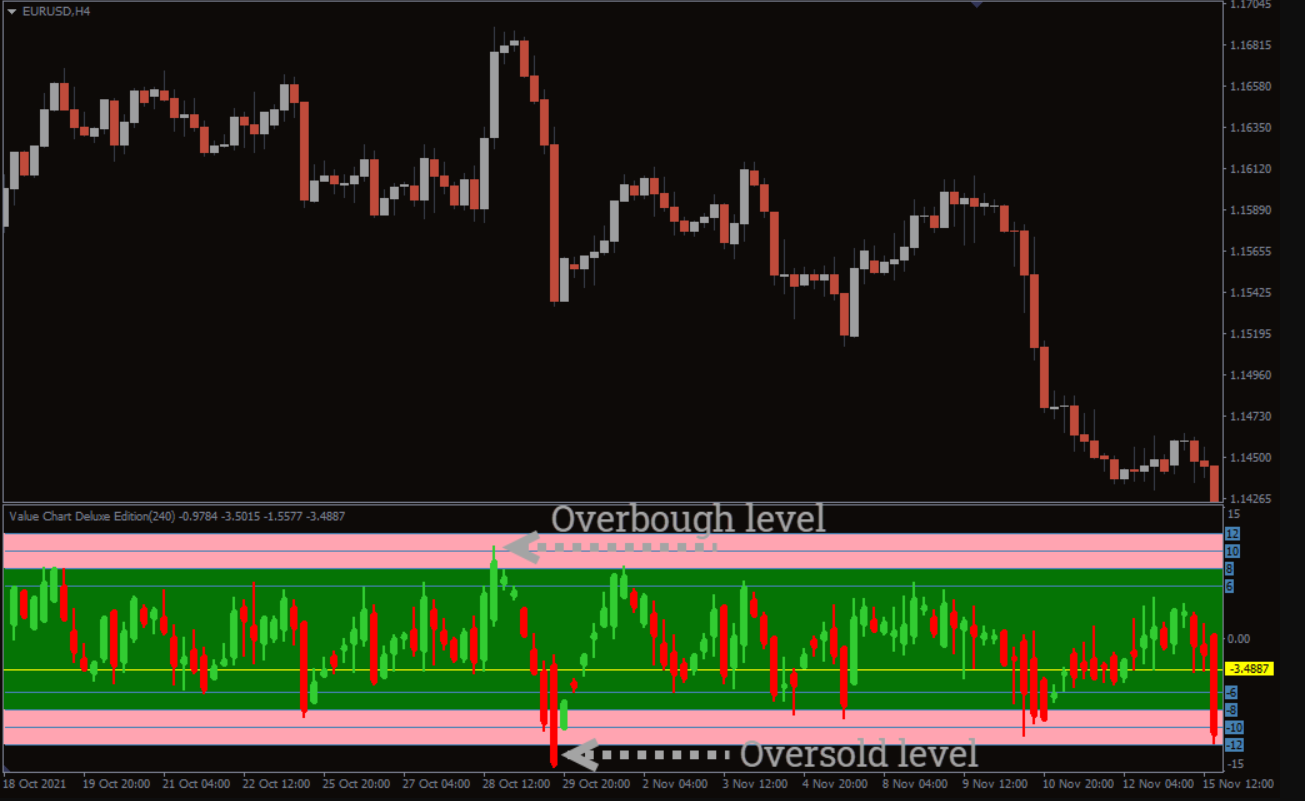
Below is how the indicator typically appears on your MT4 chart. It is displayed in a sub-window as a candlestick-style reading of market value. The indicator should be used alongside your preferred strategy rather than alone.
BUY Setup
Identify a possible bullish signal using your main strategy (price action, support/resistance, trendline, MA crossover, etc.).
Check the Value Chart Deluxe window.
Enter a BUY trade if the indicator’s candlestick is touching or dipping into the oversold zone.
This alignment suggests price is undervalued and may soon move upward.
SELL Setup
Identify a bearish move using your main technical tools.
Confirm using the Value Chart Deluxe window.
Enter a SELL trade when the indicator’s candlestick touches or enters the overbought zone.
This indicates price is overvalued and likely to reverse downward.
Tips for Better Results
Combine the Value Chart Deluxe Indicator for MT4 with RSI, MACD, or market structure.
Avoid trading during high volatility spikes unless using a volatility-based strategy.
Use the indicator as confirmation, never as a standalone signal generator.
Who Should Use It?
The tool is beneficial for:
Novice traders needing clear visual guidance.
Scalpers looking for quick reversal points.
Swing traders searching for overextended price moves.
Advanced traders wanting added confirmation on entries.
Conclusion
The Value Chart Deluxe Indicator for MT4 is a versatile and reliable tool that helps traders identify extreme price conditions and exploit market reversals. It highlights zones where price is likely to turn, making it perfect for both confirmation and decision-making. Best of all, the indicator is completely free to download.
To access more high-quality tools like this, visit IndicatorForest.com and upgrade your trading with professional MT4/MT5 indicators.
FAQ
25 Downloads
Published:
Dec 12, 2025 09:20 AM
Category: