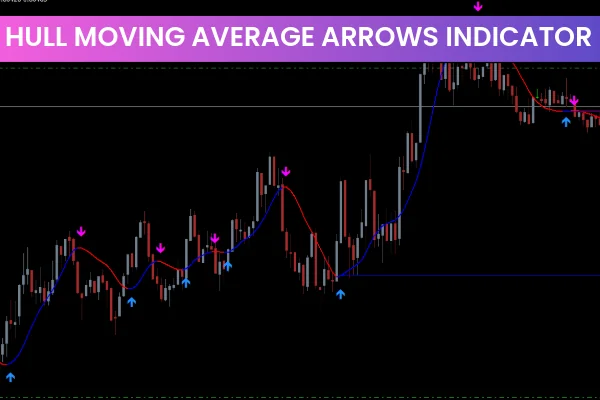
The Hull Moving Average Indicator MT4 is designed to provide crystal-clear buy and sell signals while reducing lag compared to traditional moving averages. This makes it a powerful choice for day traders, scalpers, and swing traders who rely on real-time market movement. The Hull Moving Average (often referred to as HMA) is known for its smooth trend detection and rapid response to Price Action, making it a valuable tool in fast-moving markets.
Unlike standard moving averages such as SMA or EMA, the Hull Moving Average Indicator MT4 uses advanced smoothing to deliver faster and more accurate signals. It also adds visual elements including trend-colored lines, support/resistance levels, and arrows that indicate potential trade entries. This combination allows traders to analyze the market more efficiently and react to trends with greater confidence.
How the Hull Moving Average Indicator MT4 Works
The indicator evaluates the market trend by calculating a refined moving average formula and applying it to price movement. When the trend turns bullish, the indicator line shifts to dodger blue, signaling upward momentum. When the market turns bearish, it changes to magenta, indicating downward sentiment.
Additionally, the indicator plots buy and sell arrows. These signals appear when a Trend Reversal or breakout occurs, making it especially helpful for confirmation in various strategies, such as price action, support/resistance breaks, and supply/demand zones.
How to Trade Using the Hull Moving Average Indicator MT4
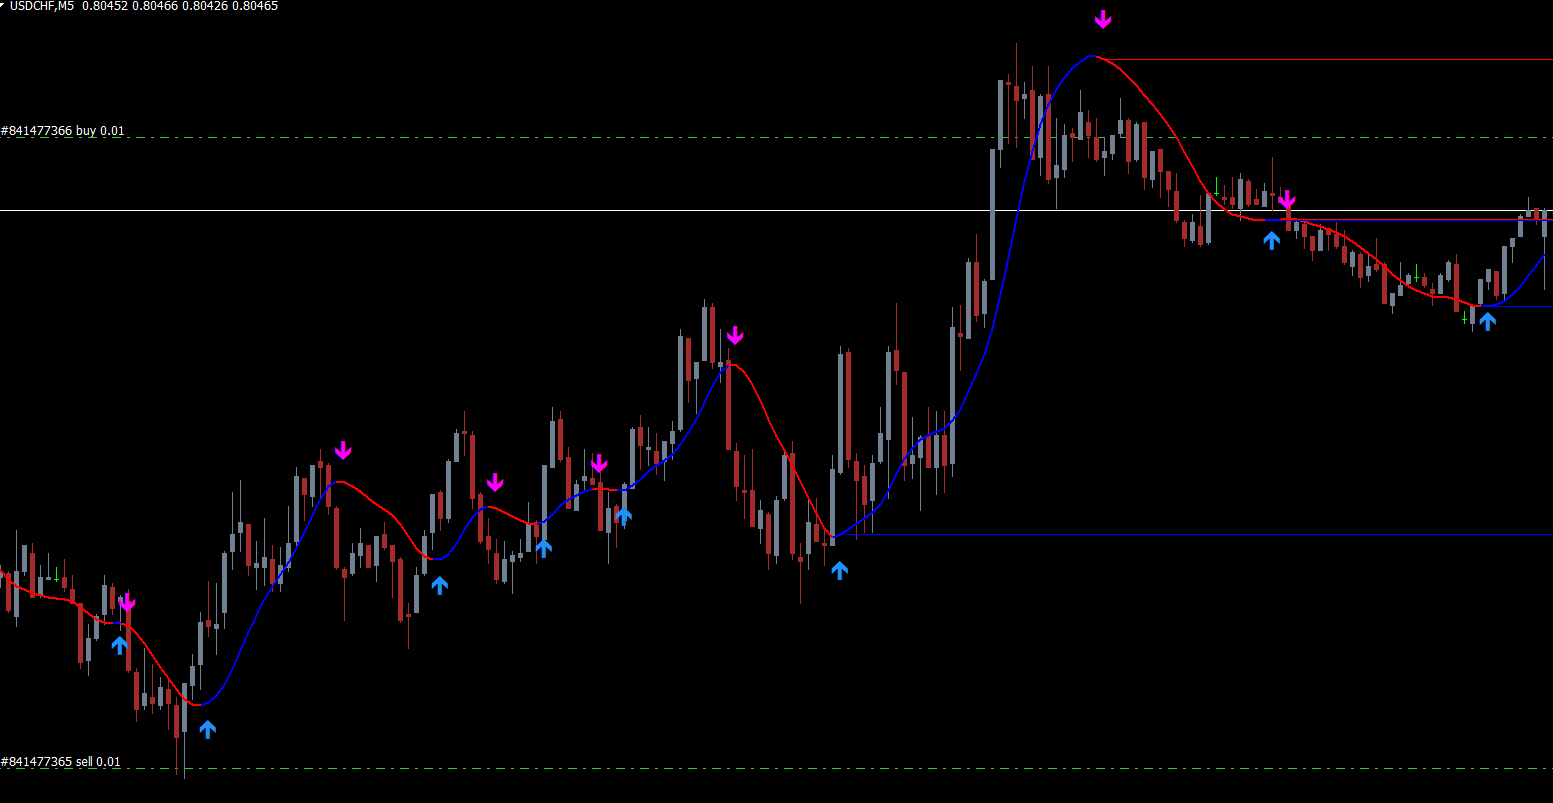
To use the Hull Moving Average Indicator effectively, traders should combine it with price action or structure-based analysis. For example:
When the indicator prints a buy arrow and the trend line turns blue, traders may look for bullish candlestick patterns, such as pin bars or engulfing formations, near support zones.
When the indicator prints a sell arrow and the line turns magenta, traders may look for bearish confirmation, such as rejection wicks or supply zones.
In the example scenario from an EURUSD chart on the M15 timeframe, multiple rejections occurred at the upper zone, suggesting a possible reversal. Shortly afterward, the indicator issued a sell arrow, followed by a visible supply zone. This alignment created a clear high-probability entry opportunity.
Benefits of Using Hull Moving Average Indicator MT4
Extremely low lag compared to traditional moving averages
Built-in buy and sell arrows for easy entry confirmation
Visual trend recognition with color-changing line
Automatic Support And Resistance areas for exits and stop-loss logic
Suitable for beginners, intermediate, and advanced traders
Because it adapts quickly to price movement, the Hull Moving Average Indicator MT4 works well for fast charts such as M1, M5, and M15, yet remains reliable on higher timeframes like H1, H4, or Daily.
Final Thoughts
The Hull Moving Average Indicator MT4 is an excellent trading tool that blends simplicity with advanced trend logic. Whether you trade forex, crypto, indices, or metals, this indicator helps eliminate guesswork by visually identifying trend direction, momentum changes, and potential entry zones.
You can download this indicator now at IndicatorForest.com and explore more professional MT4 and MT5 tools designed to improve technical trading performance.
FAQ
5 Downloads
Published:
Dec 07, 2025 01:42 AM
Category: