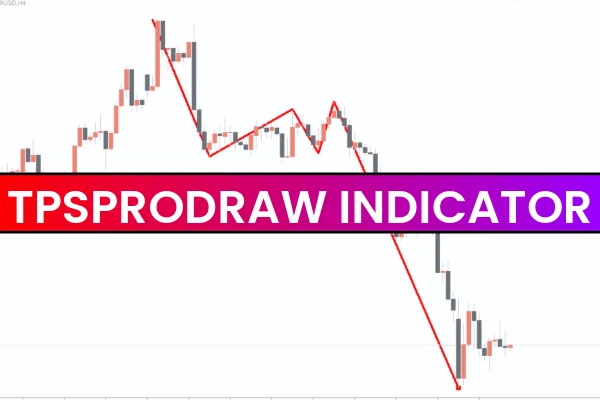
The TPSproDraw Indicator is a lightweight and easy-to-use MT4 tool that helps traders manually draw zigzag patterns on their charts. Unlike standard zigzag indicators that automatically plot swing highs and lows, TPSproDraw gives full control to the trader by allowing them to draw and remove zigzag lines manually using simple keyboard shortcuts.
This tool is perfect for traders who prefer a more hands-on approach to chart analysis and want to mark patterns manually without being restricted by pre-coded zigzag algorithms.
How the TPSproDraw Indicator Works
After attaching the indicator to your MT4 chart:
Double-press the Z key → Start drawing the zigzag line
The indicator will continue drawing the line as you move your cursor
Single-press the Z key → Stop drawing the line
Press Esc or Shift → Instantly remove the entire zigzag pattern
Since the tool allows manual plotting, traders can choose specific swing points and tailor the zigzag pattern according to their market interpretation.
The TPSproDraw Indicator works smoothly on all timeframes, making it ideal for scalpers, intraday traders, swing traders, and position traders.
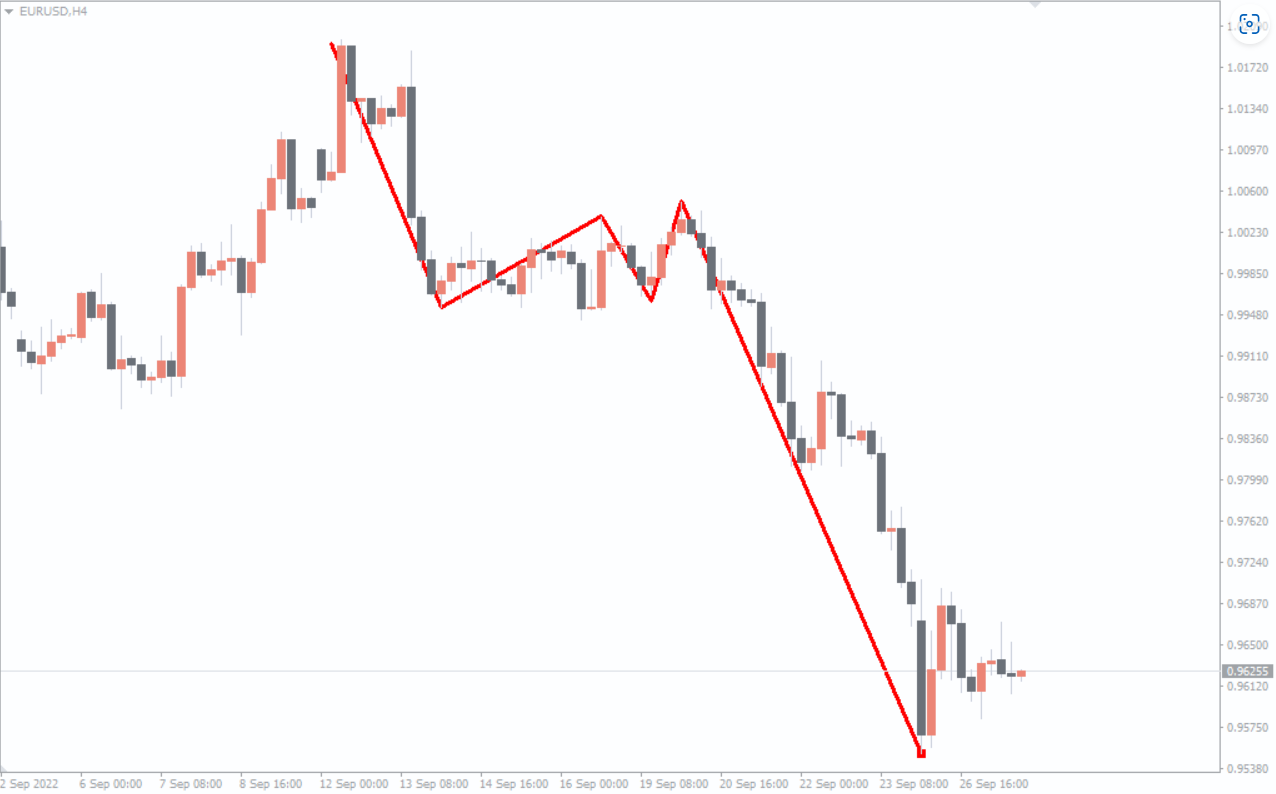
TPSproDraw Indicator Buy/Sell Signal Interpretation
The example EUR/USD H4 chart shows how the TPSproDraw pattern appears on the price chart.
To determine BUY or SELL signals, traders must first draw the zigzag structure based on major highs and lows.
Here’s how to interpret it:
BUY Signals
When the zigzag pattern shows higher lows
Look for the price to bounce from a swing low
Confirm with additional indicators (RSI, trendlines, moving averages)
SELL Signals
When the zigzag structure forms lower highs
Price rejects a swing high
Confirm bearish momentum using tools like MACD or Ichimoku
Because the TPSproDraw Indicator is manual, it gives traders flexibility to identify true Market Structure instead of relying on automated swing detection.
Why Use the TPSproDraw Indicator?
✔ Full control over swing high/low selection
✔ Works on all market types (forex, crypto, indices, metals)
✔ Clean charts with no automatic clutter
✔ Ideal for pattern traders (Elliott Wave, harmonic, Price Action)
✔ Helpful for identifying:
Trends
Corrections
Impulses
Wave structure
Support/resistance levels
Conclusion
The TPSproDraw Indicator for MT4 is a powerful tool for traders who prefer manually drawing zigzag patterns to analyze market structure and trend direction. Since the indicator gives traders complete control over swing points, it is best used in combination with other technical indicators to confirm signals.
You can download the TPSproDraw Indicator for free on our website and start enhancing your charting workflow today.
FAQ
10 Downloads
Published:
Dec 11, 2025 09:40 AM
Category: