Capturing Institutional Trends with the ADX Channel Indicator
In the highly competitive landscape of Forex and CFD trading, the ability to separate a powerful, sustained trend from a low-volume consolidation phase is what distinguishes profitable technical analysts from the rest. While classic oscillators help find market overextensions, they frequently fail during aggressive breakout moves. To solve this problem, institutional trading frameworks rely heavily on the Average Directional Index (ADX) to gauge trend intensity. The ADX Channel indicator upgrades this math, embedding directional strength channels directly onto your MetaTrader price chart.
What is the ADX Channel Indicator?
The traditional ADX indicator operates in a separate sub-window beneath the chart, tracking Trend Strength on a scale from 0 to 100 via a single line alongside Plus ($+DI$) and Minus ($-DI$) directional lines. While highly effective, constantly looking back and forth between price candles and sub-window lines can cause execution lag and cognitive fatigue.
The ADX Channel indicator elegantly solves this structural challenge by translating raw volatility and trend-strength metrics into an interactive price-overlay channel. By calculating true market range and institutional volume flow, the indicator establishes mathematical bands that contract during tight, low-liquidity ranges and expand dramatically when an asset catches a macro-wave. This visual architecture lets you track trend structural shifts, momentum levels, and key pivot zones simultaneously.
Analyzing Real-Time Market Cues
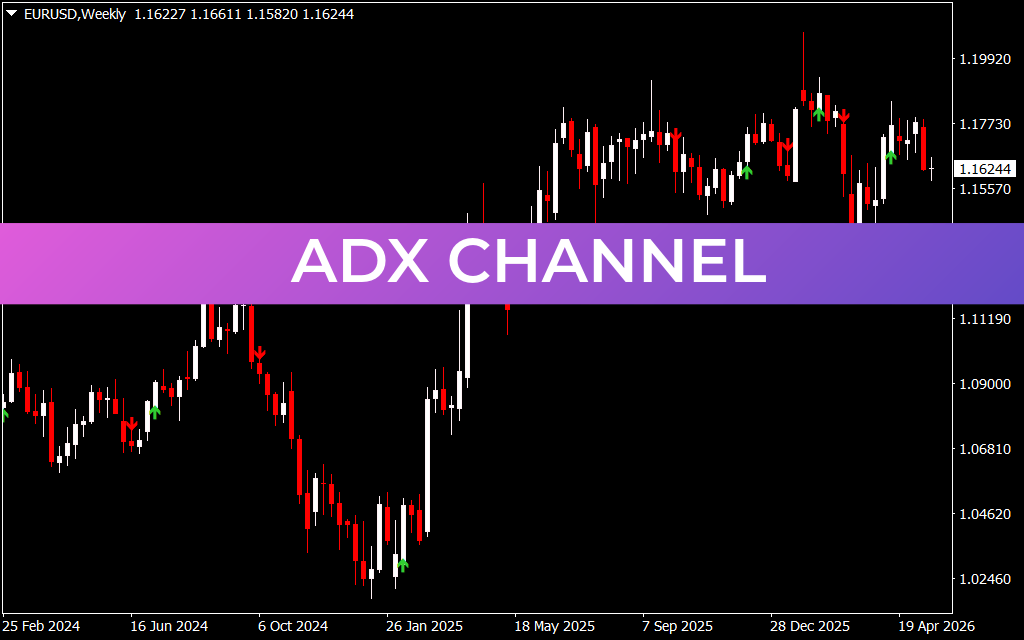
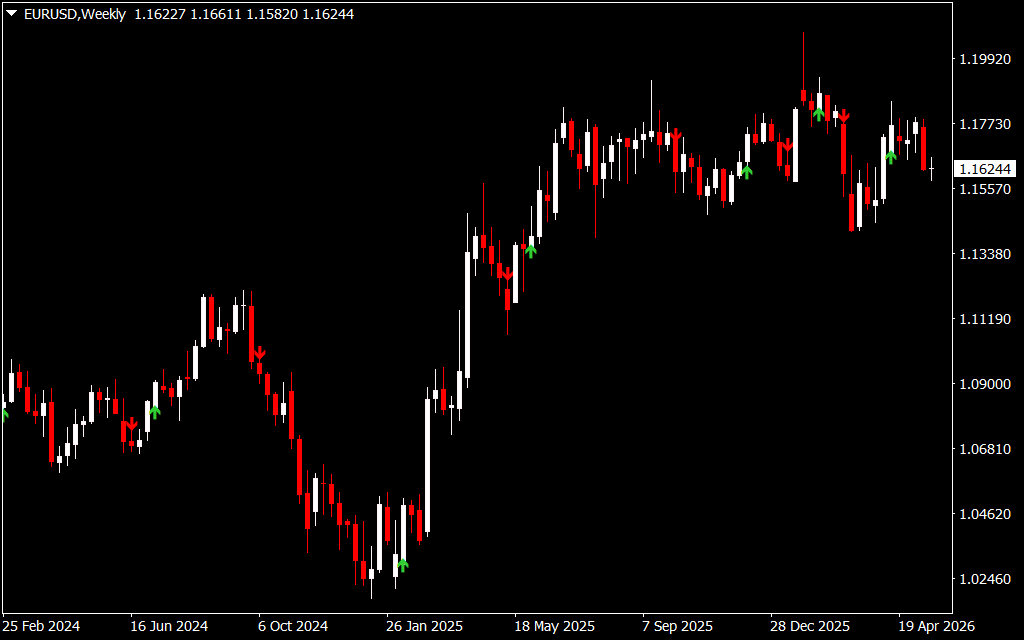
As illustrated on the weekly (Weekly) long-term macro chart for the EUR/USD pair, the ADX Channel functions as an advanced, non-repaint visual roadmap for trending markets:
- Bullish Breakout and Continuation Alerts (Green Upward Arrows): When the underlying Market Structure transitions out of a range and the ADX line confirms accelerating trend strength, a clean green upward arrow is plotted beneath the candle. This signals a highly resilient buying environment where long setups have a massive statistical edge.
- Bearish Breakdown and Distribution Alerts (Red Downward Arrows): Conversely, when intense selling pressure takes hold and the market breaks structural support boundaries, the system prints a red downward arrow above the asset's high. This serves as an immediate warning to stop buying and prepare for downward trend acceleration.
Because these arrow alerts are deeply tied to ADX volatility thresholds, they naturally filter out the false breakouts that plague retail standard moving average systems.
Strategic Multi-Timeframe Implementation
To maximize the efficiency of the ADX Channel indicator, technical analysts should implement a structured top-down approach:
- Macro Trend Identification: Utilize the weekly or daily charts to establish the primary market bias based on the ADX Channel arrows. If the macro trend prints a fresh green arrow, your core trading goal should be buying pullbacks on lower charts.
- Execution Timing: Move down to execution charts like the H1 or H4. Wait for price to pull back to the median area of the lower-timeframe ADX Channel, and execute precisely as momentum realigns with your larger macro bias.
By removing structural guesswork, the ADX Channel indicator streamlines your analysis, helping you spot big market trends with institutional precision.
3 Downloads
Last Update:
May 21, 2026 02:31 AM
Published:
Jan 18, 2026 13:58 PM
Category: