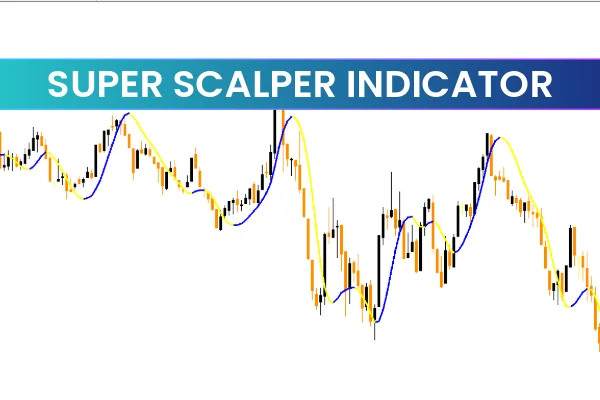
The Super Scalper Indicator is a custom-built MT4 trading tool that automatically scans Price Action to detect emerging short-term trends. It uses a unique blend of moving averages and oscillators to determine the market’s bias and instantly plots buy/sell signals on the chart.
When a bullish trend is detected, the signal line turns blue, signaling an upward momentum and potential buy opportunities. Conversely, during a bearish market, the line switches to red, indicating downward movement and possible short entries.
A third yellow color sometimes appears, showing a neutral or transition phase, warning traders to wait before entering the market. This real-time visual feedback makes it one of the easiest tools for quick trading decisions.
How the Super Scalper Indicator Determines Buy-Sell Signals
The Super Scalper works by constantly analyzing price behavior, trend direction, and momentum strength.
Here’s how it generates signals:
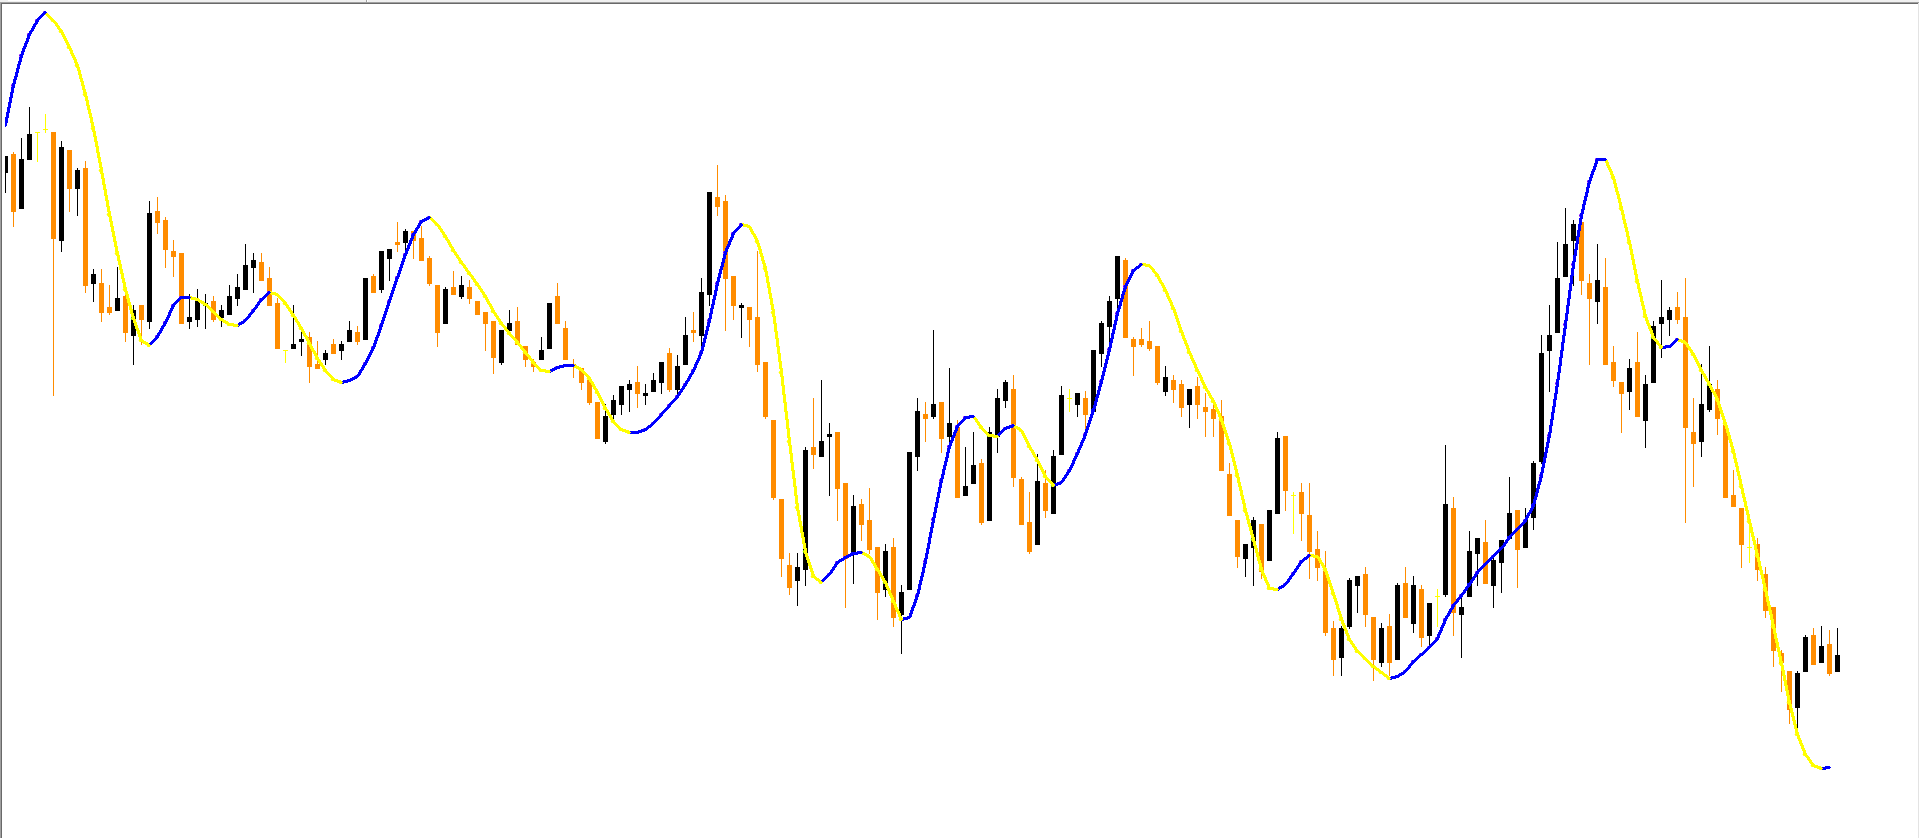
Buy Signal: When the indicator line turns blue, it suggests the market is gaining bullish momentum. Enter buy positions, preferably near support zones, for optimal entries.
Sell Signal: When the indicator line turns red, it indicates bearish control. Look for sell entries near resistance levels to align with the trend.
Neutral Signal: A yellow line signals indecision or potential reversal—avoid trading during this stage.
For instance, in the EUR/USD 30-minute chart, the indicator produced multiple profitable buy entries whenever price rebounded from a support zone and the signal line changed to blue. Similarly, when the price rejected resistance and the line switched to yellow or red, short trades became more favorable.
By combining the Super Scalper with basic tools like support/resistance or moving averages, traders can filter false signals and strengthen accuracy.
Key of Features Super Scalper Indicator MT4
Real-Time Buy/Sell Alerts: Automatically detects trade opportunities based on short-term market trends.
Multi-Timeframe Compatibility: Works seamlessly on M1 to D1 charts.
Color-Coded Trend Signals: Blue = Buy, Red = Sell, Yellow = Neutral.
Beginner-Friendly Interface: Clean, simple, and easy to interpret.
Customizable Settings: Adjust sensitivity and colors for different trading styles.
Works on All Assets: Forex, commodities, indices, and crypto markets.
These features make the Super Scalper Indicator one of the most reliable and visually clear Scalping tools available for the MetaTrader 4 platform.
Trading Tips for the Super Scalper Indicator
Always confirm signals with support/resistance levels or a trendline breakout.
Avoid trading during high-impact news events, as short-term volatility can distort signals.
Combine with a stop-loss strategy to protect profits from rapid market reversals.
For best results, use M5 or M15 timeframes for intraday setups and H1 for short swing trades.
Conclusion
The Super Scalper Indicator MT4 is a simple yet highly efficient trading tool for short-term market analysis. It helps traders quickly identify trend reversals and take advantage of scalping opportunities with ease.
While it’s user-friendly and visually clear, traders should still apply proper risk management to avoid overtrading during volatile periods.
👉 Download the Super Scalper Indicator free at IndicatorForest.com and start trading with precision and confidence today!
FAQ
2 Downloads
Published:
Nov 10, 2025 13:43 PM
Category: