Mastering Volatility and Trends with the Bands LSMA Indicator
In the fast-paced world of intraday trading, distinguishing between a healthy trend and market noise is a constant challenge. The Bands LSMA indicator for MT4 and MT5 offers a sophisticated solution by merging linear regression mathematics with volatility-based envelopes. Unlike standard moving average bands, the LSMA (Least Squares Moving Average) variant is designed to be more responsive to recent price changes while maintaining a high degree of smoothness, making it a favorite for scalpers and day traders alike.
What is the Bands LSMA?
The Least Squares Moving Average, also known as an End Point Moving Average, calculates a regression line for each period and projects where the price "should" be based on the current trend. When you wrap this central line in dynamic bands, you create a powerful volatility channel.
- The Central LSMA Line: This acts as the baseline for the current trend. When price is above a rising LSMA line, the bias is bullish; when below a falling line, the bias is bearish.
- The Outer Bands: These bands expand and contract based on market volatility. They represent statistical extremes, helping traders identify when the price has moved too far, too fast.
Key Benefits for Technical Analysis
- Reduced Lag: One of the primary advantages of the LSMA formula is that it has significantly less lag than a Simple or Exponential Moving Average. This allows traders to enter trends earlier and exit before a reversal wipes out profits.
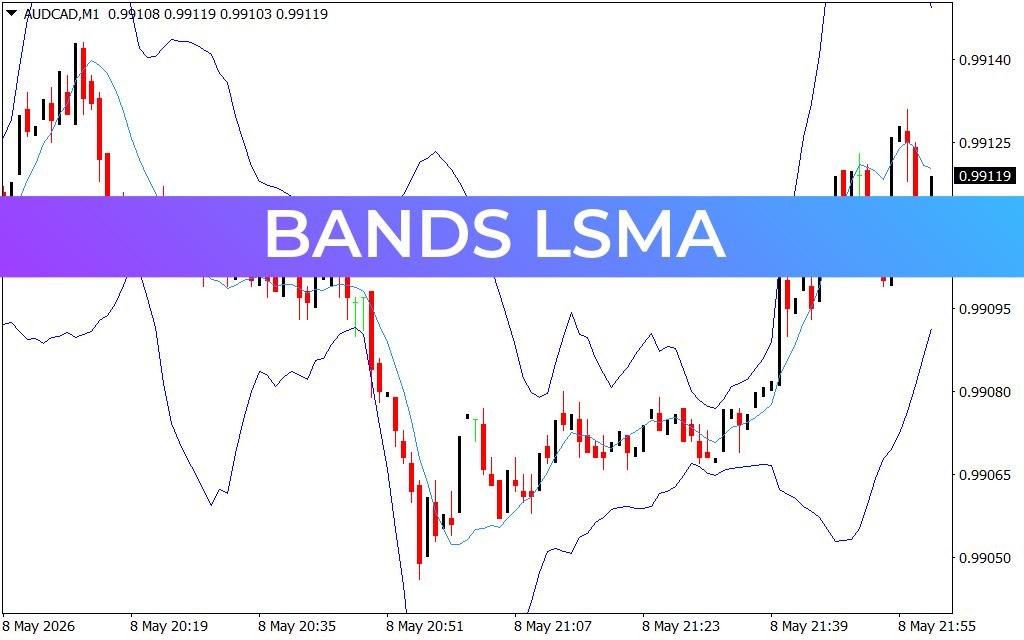
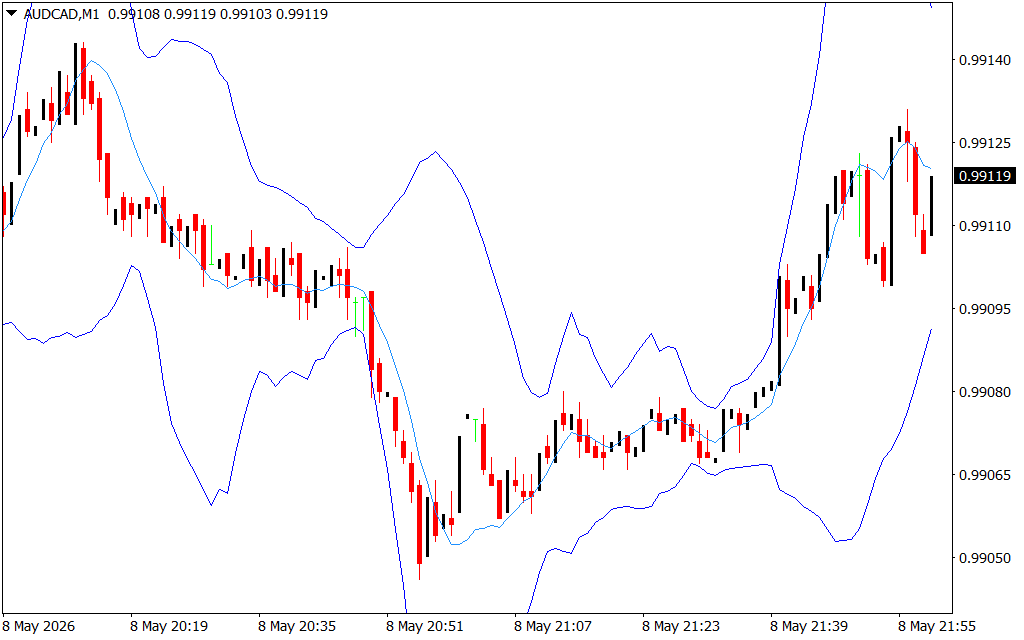
- Identification of Exhaustion: As seen in the AUDCAD chart, when the price pushes outside the blue outer bands, it is in an "overextended" state. Professional traders often look for price to snap back toward the central LSMA line, providing excellent mean-reversion opportunities.
- Volatility Filtering: During quiet market sessions, the bands contract, warning traders of low-probability environments. A "squeeze" followed by a sharp expansion often precedes a major price breakout.
- Visual Clarity: The indicator provides an immediate visual map of the Market Structure. The smooth, flowing nature of the LSMA helps traders remain calm during minor price fluctuations, focusing only on the broader directional move.
Strategic Trading Applications
The Bands LSMA is exceptionally versatile. Scalpers can use it on the M1 or M5 timeframes to trade "band-to-band" bounces during ranging markets. For trend followers, the indicator serves as a trailing stop-loss; as long as the price remains supported by the central LSMA line, the trend is considered intact.
By integrating the Bands LSMA into your trading terminal, you replace standard lagging indicators with a mathematically superior tool that adapts to the market's current velocity. Whether you are looking for trend confirmation or reversal signals, this indicator provides the precision needed for a professional edge.
1 Download
Last Update:
May 09, 2026 01:04 AM
Published:
Jan 25, 2026 16:29 PM
Category: