Master Market Cycles with the CWR Indicator for MT4/MT5
In the world of professional trading, understanding market geometry is the key to identifying high-probability entry points. Many retail traders struggle to identify where a correction ends and a trend resumes. The CWR Indicator—which stands for Current Wave Retracement—is a sophisticated technical utility designed to automate this complex process. By combining wave theory with Fibonacci mathematical ratios, the CWR provides a clear roadmap of Price Action directly on your MetaTrader charts.
The Logic of Current Wave Retracement
Financial markets move in waves. For every impulsive move, there is typically a corrective retracement before the next expansion occurs. The CWR Indicator tracks these "waves" in real-time, providing two critical layers of analysis:
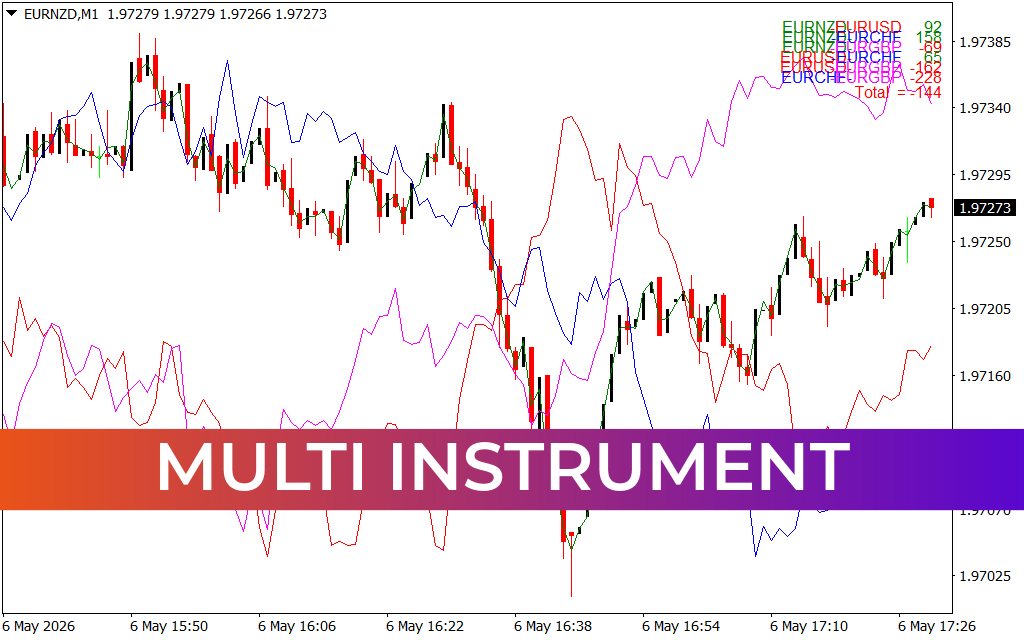
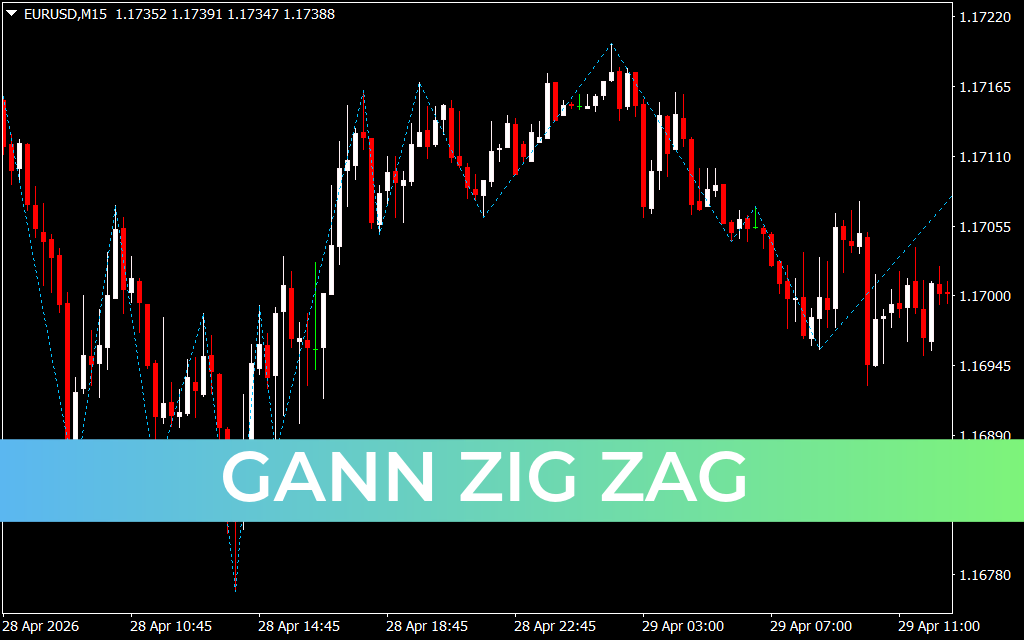
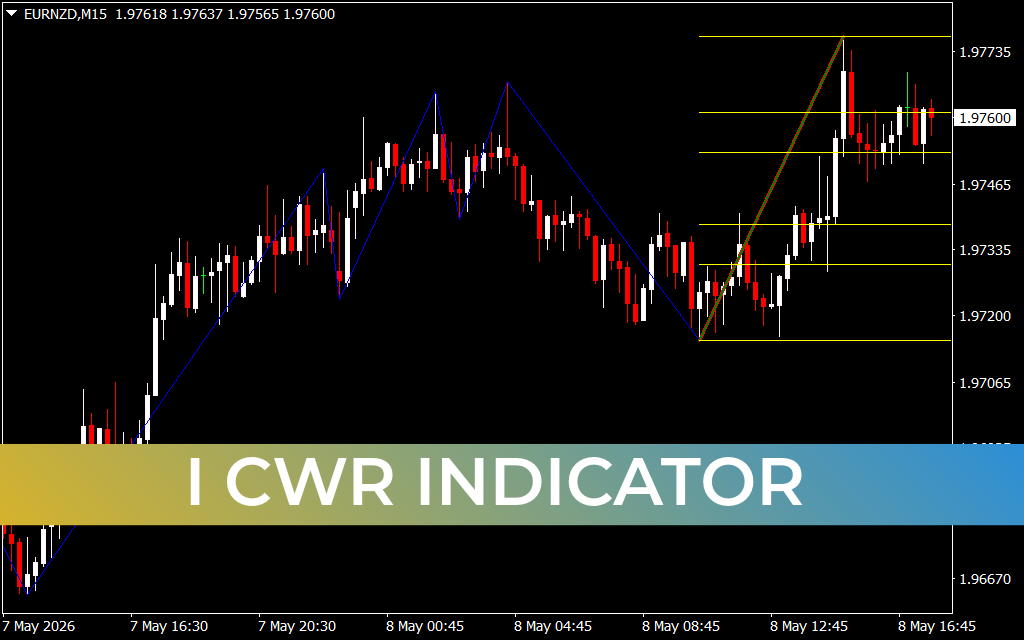
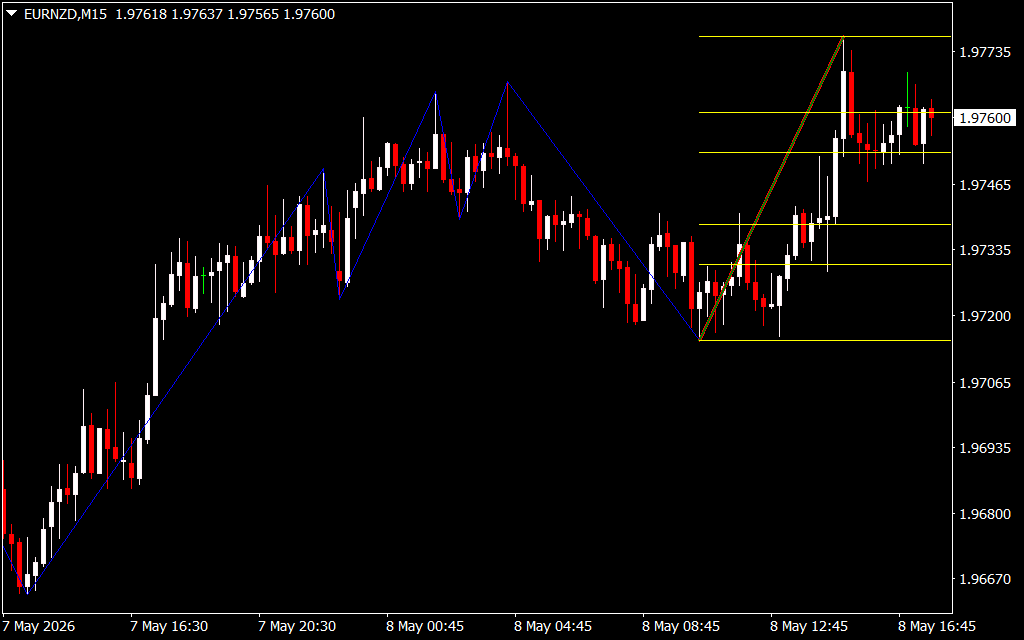
- Automated Wave Identification: The indicator plots blue and yellow lines to connect significant swing highs and lows. As seen in the EURNZD M15 example, it creates a visual "zigzag" structure that highlights the current market phase.
- Dynamic Fibonacci Levels: Once a wave is established, the indicator automatically projects horizontal Fibonacci retracement levels (such as 38.2, 50.0, and 61.8). These levels act as hidden Support And Resistance zones where institutional buy or sell orders are often clustered.
Strategic Advantages for Professional Traders
- Objective Trend Analysis: By identifying the "Current Wave," the indicator removes the subjective guesswork involved in manual chart drawing. You can immediately see if the market is making higher highs or lower lows.
- Precision Pullback Entries: The CWR excels at "buying the dip" or "selling the rally." Traders look for price to exhaust itself near a key Fibonacci level (like the 61.8% golden ratio) before entering in the direction of the primary wave.
- Harmonic Pattern Recognition: Because it maps the geometry of price moves, the CWR is an excellent tool for traders who utilize harmonic patterns like Bats, Gartleys, or Butterflies.
- Multi-Timeframe Versatility: Whether you are Scalping on the M15 or swing trading on the H4, the CWR algorithm adjusts to the current chart's volatility to provide relevant cycle data.
Trading the "Golden Zone"
The most effective way to utilize the CWR Indicator is to identify the "Golden Zone"—the area between the 50% and 61.8% retracement levels. When the price enters this zone on a corrective wave, the CWR alerts the trader to look for price action reversal signals, such as pin bars or engulfing candles.
In the provided chart, we see the indicator mapping a clear bullish expansion followed by a structured retracement. This allow traders to wait for the market to come to them, rather than "chasing" a move that has already extended too far. By providing a mathematical framework for price movement, the CWR Indicator transforms chaotic price action into a predictable series of tradeable waves.
2 Downloads
Last Update:
May 08, 2026 20:52 PM
Published:
Jan 25, 2026 18:26 PM
Category: