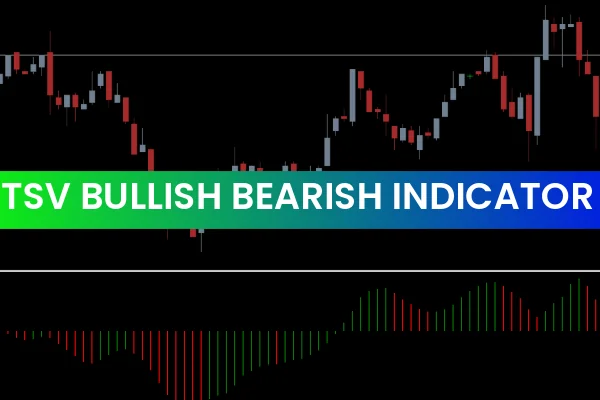
The TSV Bullish Bearish Indicator for MT4 is a simple yet effective histogram-based trading tool designed to help identify trend direction in Forex markets. By comparing averages over a specified period, it generates color-coded bullish and bearish signals, making it a useful indicator for new and advanced traders. Because it is visually clear and non-complex, it becomes a great choice for automated strategies, manual trading, and multi-timeframe analysis.
The indicator works on all major currency pairs and asset types and is compatible with any timeframe, including M1 to monthly charts. Whether you are a scalper, swing trader, or day trader, the TSV Bullish Bearish Indicator can enhance your technical analysis and improve your trading decision process.
How the TSV Bullish Bearish Indicator Works
The TSV Bullish Bearish Indicator calculates the difference between two averages and converts the result into a histogram displayed in a separate window. This histogram reflects market momentum and directional bias, providing a visual reading of whether the current trend is bullish or bearish.
A key feature of this indicator is its smooth trend transition, which helps avoid unnecessary noise and false signals, commonly seen in fast-moving markets.
Blue bars indicate bullish momentum
Red bars indicate bearish momentum
This color change allows traders to immediately identify market strength and direction without performing complex chart analysis.
Trading Signals with the TSV Bullish Bearish Indicator
Buy Signal Strategy
A potential long entry may be considered when:
A blue bullish bar appears
Price structure confirms higher highs or a breakout
Risk management aligns with market volatility
A suggested stop loss can be placed below the most recent swing low, while the target can be taken when the opposite color appears.
Sell Signal Strategy
A short entry may be valid when:
A red bearish histogram bar forms
Market confirms downside momentum
No major support zones exist directly below the entry
Profit-taking often occurs when the histogram switches back to blue.
This technique can also be used for swing confirmation or trailing stop strategies.
Multi-Timeframe Trading Approach
One of the most effective ways to use the TSV Bullish Bearish Indicator for MT4 is to combine higher timeframe direction with lower timeframe execution:
Identify trend direction on H1 or H4
Enter trades on M5, M15, or M30
Using confluence between higher and lower timeframes can significantly increase accuracy and improve trade confidence.
Why Use the TSV Bullish Bearish Indicator?
The TSV Bullish Bearish Indicator is preferred by trend traders because:
It reduces decision fatigue
It helps filter out weak trades
It works with any trading strategy
It supports automatic expert advisor integration
Traders can pair it with tools such as Moving Averages, RSI, MACD, or Price Action strategies for improved confirmation.
Conclusion
The TSV Bullish Bearish Indicator for MT4 is a powerful and beginner-friendly momentum tool that helps identify bullish and bearish market conditions using color-based histogram signals. Its simplicity, reliability, and compatibility with trend-based trading systems make it an excellent addition to any trader’s toolkit.
👉 Download the TSV Bullish Bearish Indicator today at IndicatorForest.com and explore more free and premium Forex tools to enhance your trading performance.
FAQ
2 Downloads
Published:
Dec 09, 2025 03:23 AM
Category: