The RSI Demarker Superposition Indicator for MT4 is a powerful technical analysis tool that blends three essential market indicators — the Relative Strength Index (RSI), the Demarker indicator, and moving averages. This combination harmonizes momentum and trend strength, offering traders a deeper view of market dynamics.
Unlike using RSI or Demarker alone, the RSI Demarker Superposition indicator merges their strengths. RSI measures the speed and change of price movements, while the Demarker indicator identifies potential price exhaustion levels. Together, they filter false signals and generate more reliable trade setups.
This hybrid approach allows traders to identify trend direction, spot reversals, and confirm entry and exit points with greater confidence.
Why Combine RSI with the Demarker Indicator?
When analyzing markets, RSI and Demarker are both momentum oscillators, but they react differently to price changes. RSI is sensitive to overbought and oversold conditions, while Demarker focuses on the relationship between recent highs and lows.
Combining both through the RSI Demarker Superposition MT4 Indicator creates a balanced trading system that captures multiple aspects of momentum.
Best Indicator to Use with RSI
One of the best indicators to use with RSI is the Demarker indicator because it complements RSI’s behavior. While RSI might signal an overbought condition early, the Demarker can confirm whether momentum truly supports that signal.
As a result, the RSI Demarker Superposition helps traders avoid premature entries and provides a more accurate reading of market strength or weakness.
How to Trade with the RSI Demarker Superposition Indicator
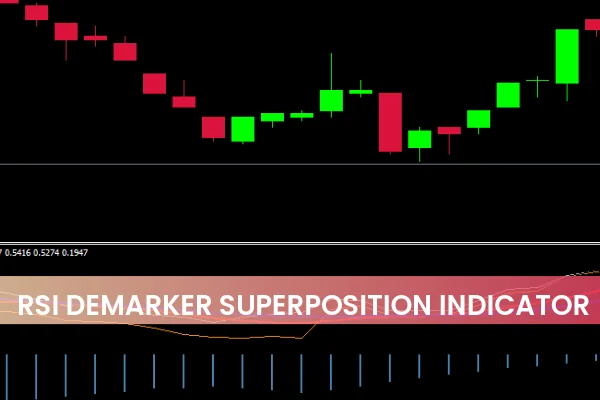
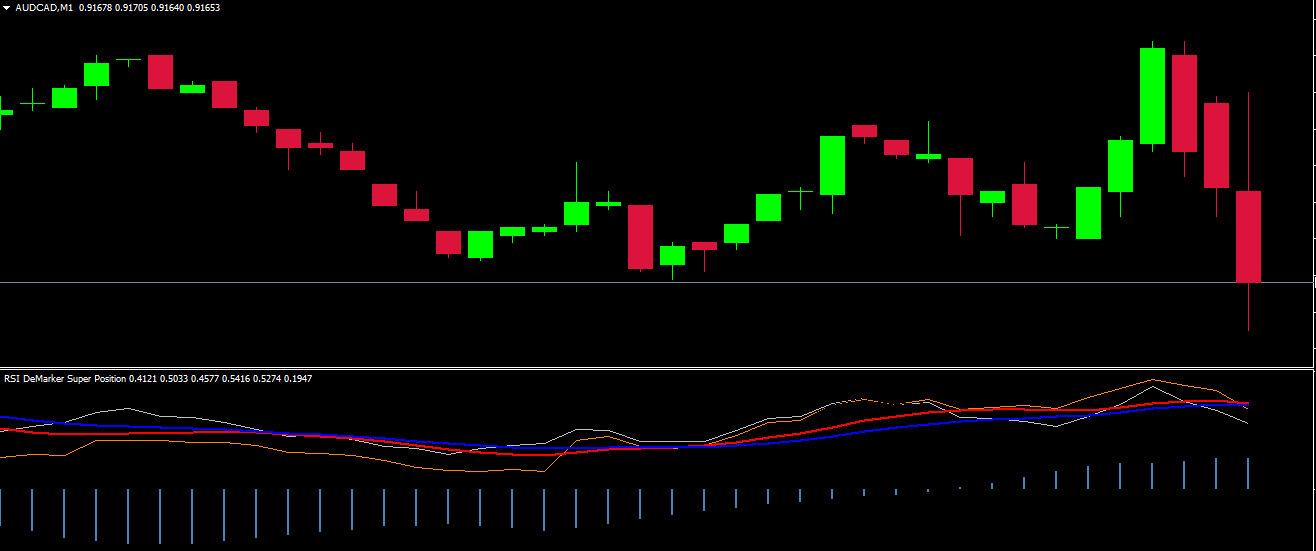
The RSI Demarker Superposition Indicator includes:
Red and blue moving averages for trend direction
Silver (RSI) and dark orange (Demarker) lines for momentum
Histogram bars that add confluence for trend confirmation
Here’s how to interpret and trade with the indicator:
Identify the Trend Bias
When both the RSI and Demarker lines are above the moving average, the market is bullish. Conversely, when both are below the moving average, the market is bearish.
Entry Signals
Buy Signal: When RSI and Demarker cross above the moving averages and the histogram bar is above the zero line.
Sell Signal: When RSI and Demarker cross below the moving averages and the histogram bar is below the zero line.
Filter False Signals
Only trade when the histogram bar direction aligns with the crossover signal. This step helps you avoid false breakouts and ensures the trend is supported by momentum.
Benefits of the RSI Demarker Superposition Indicator
Improved accuracy: Filters noise using two momentum indicators and moving averages.
Trend and momentum confirmation: Ideal for both short-term and long-term strategies.
Versatile application: Works effectively across forex, indices, and commodities.
Visual clarity: Uses clear color coding for quick interpretation.
This makes it a great addition to any trader’s MT4 toolkit.
Conclusion
The RSI Demarker Superposition Indicator for MT4 is a sophisticated tool that enhances market analysis by combining the RSI, Demarker, and moving averages. It provides clearer signals, better confluence, and improved decision-making power.
Whether you’re a day trader or swing trader, this indicator can help you spot trend reversals and align trades with true market momentum.
Download and explore the RSI Demarker Superposition Indicator today at IndicatorForest.com — your trusted source for premium MT4 and MT5 trading tools.
1 Download
Published:
Nov 01, 2025 13:44 PM
Category: