The Trend Intensity Index 2 Indicator for MT5 is a refined and improved version of the original trend intensity tool. Designed specifically for forex traders, this indicator helps identify trend direction, market strength, and momentum with visual accuracy. Whether you trade manually or follow automated strategies, the Trend Intensity Index 2 Indicator makes trend recognition faster and more reliable.
Trend trading remains one of the most effective strategies in the forex market. The key principle is simple — buy in an uptrend and sell in a downtrend. With the Trend Intensity Index 2 Indicator, traders can easily determine whether the market is trending, where the trend is heading, and if momentum supports entry or exit decisions.
You can download this indicator for free at IndicatorForest.com, where you will also find more premium and free forex tools for MT4 and MT5.
How the Trend Intensity Index 2 Indicator Works
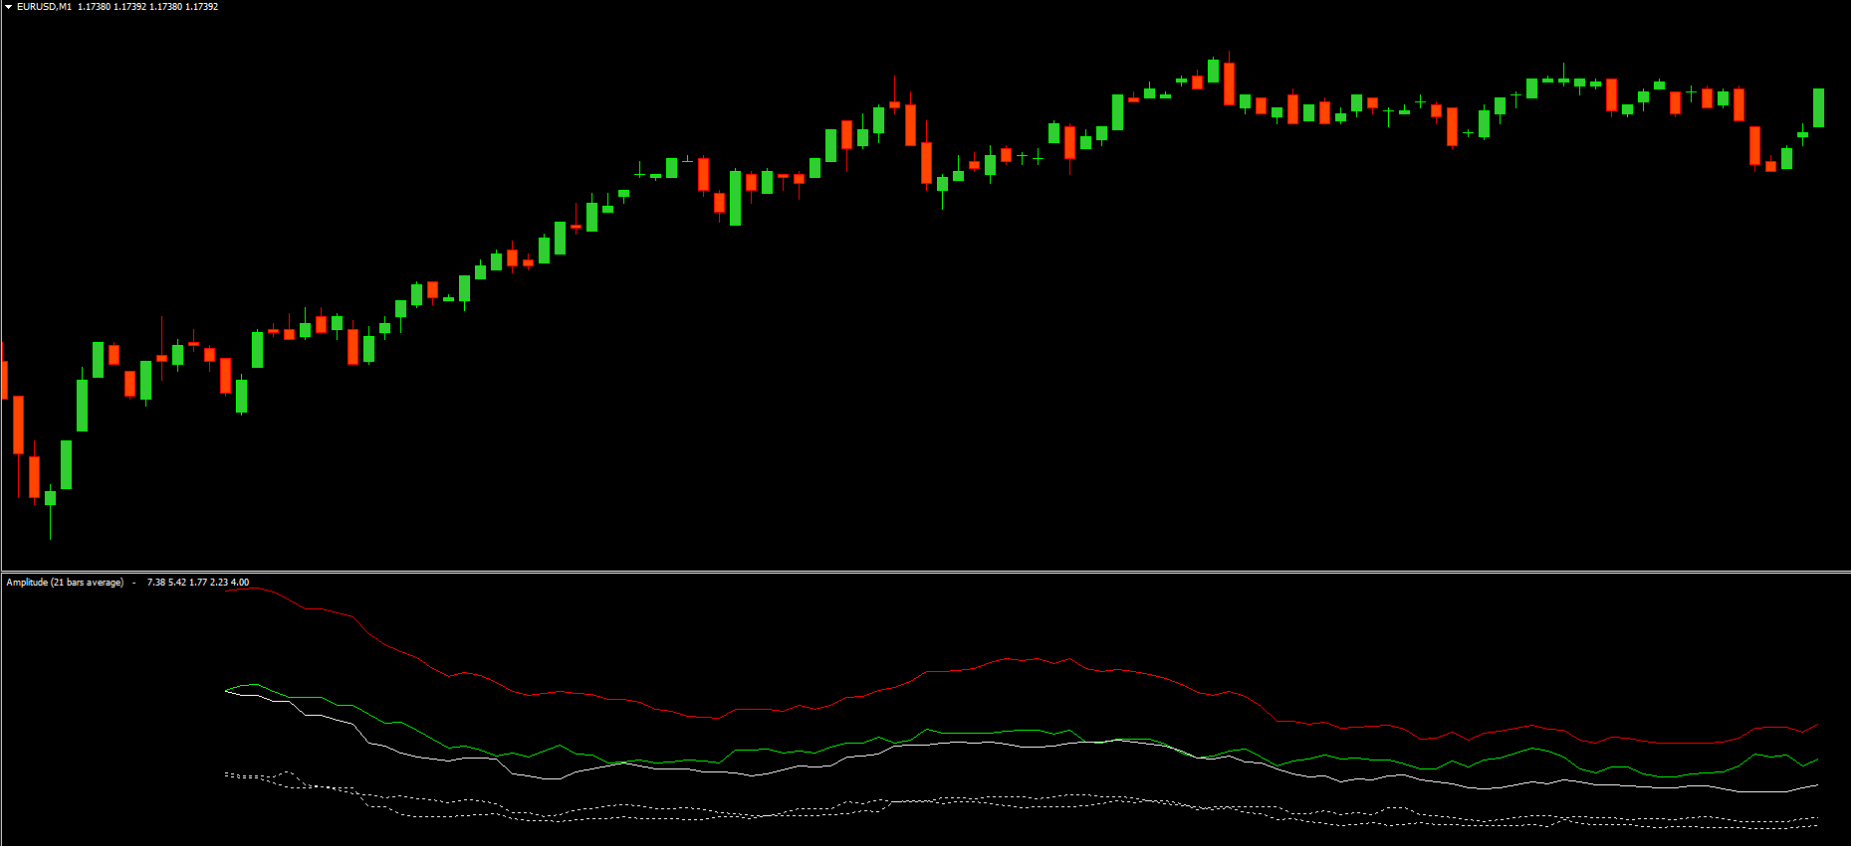
This indicator displays a colored signal line in a separate MT5 window. The signal line changes color and position depending on market strength and trend direction.
Below Level 20 (Brown): Indicates the market is oversold. Traders should watch for bullish reversal signals.
Crossing Above Level 20: Signals a potential upward trend shift — suitable for long positions.
Above Level 80 (Blue): Identifies an overbought market. Traders may look for selling opportunities.
Dropping below Level 80: Confirms weakening bullish momentum and strengthens bearish bias.
The color-coded visual helps traders instantly interpret Market Structure without confusion. The indicator also works across all timeframes, including M1, M15, H1, H4, and even weekly trading analysis.
How to Trade Using the Trend Intensity Index 2 Indicator
To trade effectively, follow these rules:
For BUY trades:
Wait until the indicator drops below level 20 (oversold).
Enter a buy trade once the signal line crosses back above 20 and shifts color.
Hold the position until the signal line reaches or exceeds level 80.
Exit when the line turns blue or begins falling from the overbought area.
For SELL trades:
Wait for the indicator value to exceed level 80.
Enter a sell trade when the signal drops below 80.
Hold the trade until the indicator returns to mid-level or oversold territory.
Combining this tool with moving averages, candlestick patterns, or RSI improves accuracy and reduces false trading setups.
Advantages of the Trend Intensity Index 2 Indicator
✔ Highly Accurate Trend Detection
✔ Works Across All Timeframes and Market Types
✔ Color-Coded Visual Signals for Easy Interpretation
✔ Perfect for Beginners and Advanced Traders
However, the indicator may produce misleading signals in choppy or consolidating markets. For that reason, traders should use it only when the price shows clear trending behavior.
Best Practices
Use higher timeframes (H1, H4, or D1) to confirm market bias.
Avoid placing trades during sideways consolidation.
Combine with support/resistance levels for stronger confirmation.
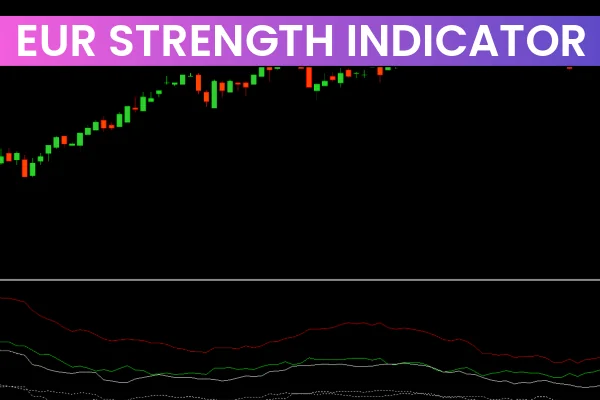
Check market sentiment using additional tools like a strength meter.
For more trading ideas, guides, and MT5 tools, visit IndicatorForest.com.
Conclusion
The Trend Intensity Index 2 Indicator for MT5 is a reliable and easy-to-use tool for measuring Trend Strength and timing entries and exits. Whether you are scalping or swing trading, this indicator offers valuable insights that help improve decision-making.
Download the Trend Intensity Index 2 Indicator today from IndicatorForest.com and level up your trading strategy.
FAQ
1 Download
Published:
Dec 07, 2025 15:19 PM
Category: