Smooth Your Trading Strategy with the Triangular MA Indicator
In the world of technical analysis, moving averages are fundamental tools for identifying market trends. However, many traders struggle with "noise"—the small, erratic price fluctuations that can trigger false signals. The Triangular MA Indicator (TMA) is a sophisticated alternative to standard moving averages, designed specifically to provide a smoother, more stable representation of Price Action. By applying a double-smoothing process, the TMA helps traders focus on the primary trend without being distracted by minor market volatility.
What is the Triangular MA Indicator?
The Triangular Moving Average is essentially an average of an average. Unlike a Simple Moving Average (SMA), which gives equal weight to all price points, or an Exponential Moving Average (EMA), which favors recent data, the TMA weights the middle of the specified time period most heavily. This results in a wave-like line that is much smoother and less prone to sudden spikes than its counterparts. This characteristic makes it an exceptional tool for identifying the core direction of the market.
Key Features and Benefits
- Superior Smoothing: The double-averaged calculation significantly reduces market noise, making it easier to visualize the underlying trend.
- Trend Identification: When the TMA is sloped upwards, the market is in a clear bullish phase. Conversely, a downward slope indicates a bearish trend.
- Dynamic Support And Resistance: Much like other moving averages, the TMA acts as a dynamic level where price often retraces before continuing its primary move.
- Ideal for Longer-Term Analysis: Because of its extreme smoothness, it is highly effective for swing traders and investors looking to stay in a trend for as long as possible.
Trading Strategies and Practical Application
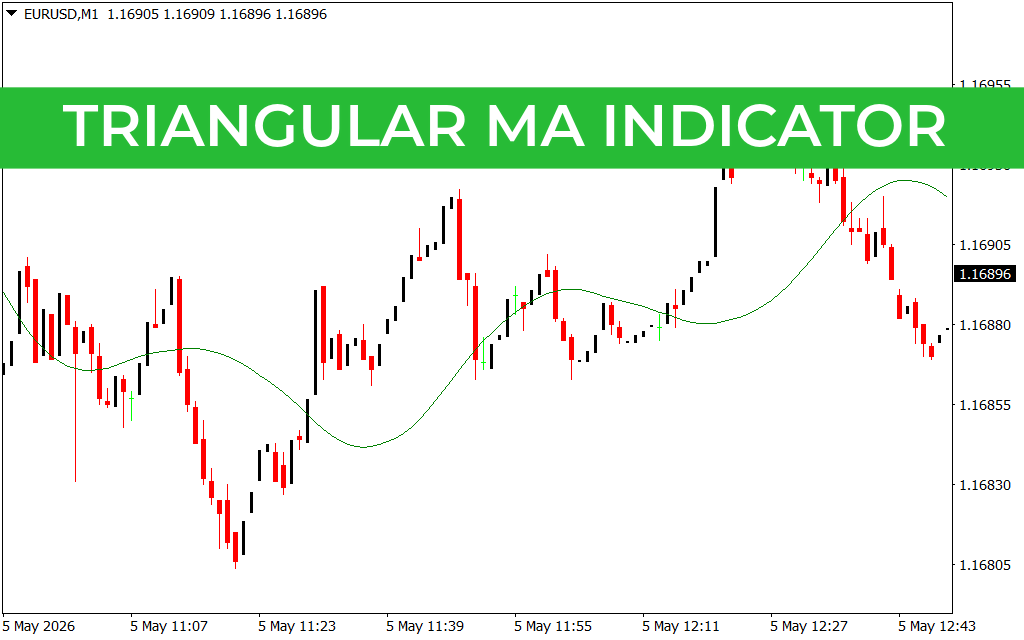
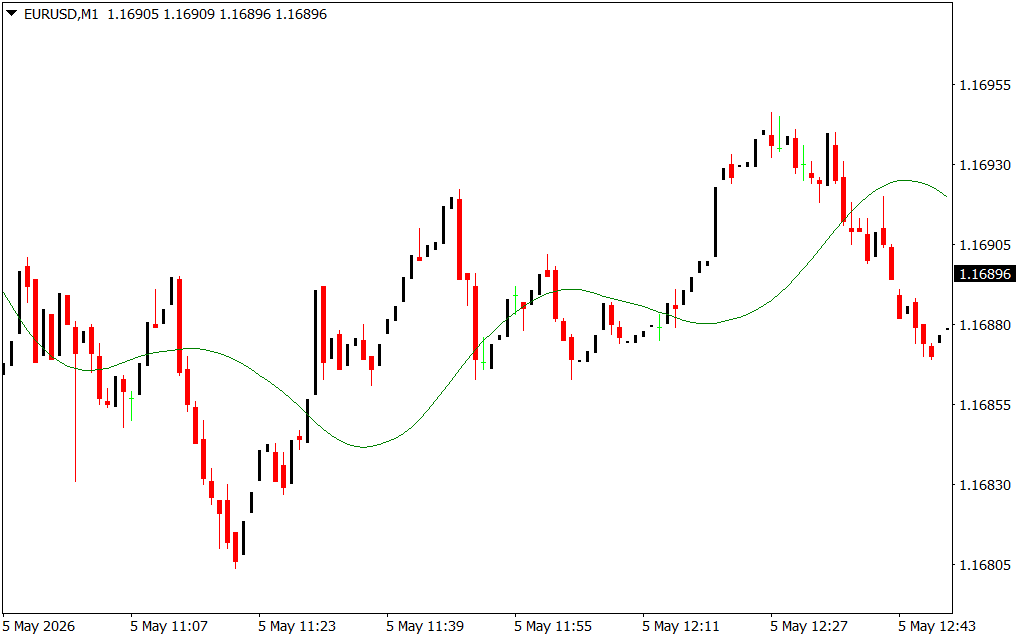
As illustrated in the file EURUSDM1_5.png, the Triangular MA Indicator appears as a graceful green line flowing through the price candles. Traders often use it in the following ways:
- Trend Confirmation: Traders look for the price to stay consistently above the TMA to maintain a long bias. A cross below the line may signal the beginning of a Trend Reversal or a deep correction.
- Crossover Strategies: Pairing a shorter-period TMA with a longer-period one can create powerful "Golden Cross" or "Death Cross" signals, but with fewer false entries than standard averages.
- Price Action Integration: Many experts use the TMA alongside Price Action Trading. For example, a bullish engulfing pattern occurring right as the price touches the TMA line provides a high-probability entry point.
Why Choose the TMA over Standard Averages?
The primary advantage of the Triangular MA Indicator is its stability. While an EMA might react too quickly to a news-driven spike, the TMA maintains its composure, helping you avoid "whipsaws." It is a vital tool for anyone specializing in Forex trading strategies or momentum trading, providing the clarity needed to make disciplined decisions in a chaotic market environment.
3 Downloads
Last Update:
May 05, 2026 17:42 PM
Published:
Jan 27, 2026 19:47 PM
Category: