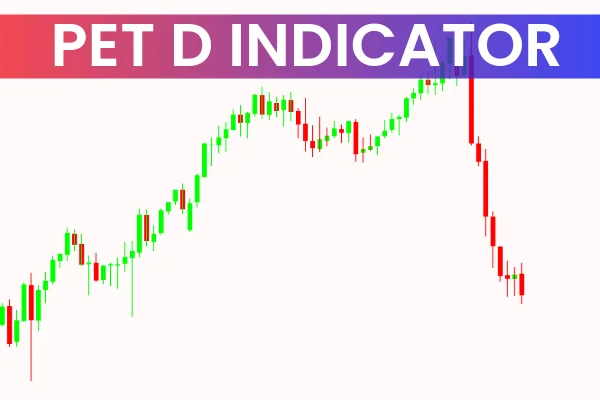
The PET-D indicator MT4—Primo Early Trend Detector—was developed by Steven Primo to help traders identify early trend direction and potential reversal points. The indicator changes the bar colors on your chart based on Trend Strength and direction, making it extremely simple for both new and professional traders to interpret.
This trend-detection tool is especially valued for its ability to highlight early momentum shifts. By coloring bullish bars green and bearish bars red, the PET-D indicator provides fast visual confirmation of market sentiment. It works equally well on intraday charts as well as daily, weekly, and monthly time frames.
Why Traders Use PET-D
The PET-D indicator is popular because it offers:
Clear BUY and SELL signals
Early trend detection
Straightforward visual interpretation
High compatibility with other indicators
Reliable performance across all markets and time frames
Beginners appreciate the ease of reading the color changes, while advanced traders use PET-D as a confluence tool to strengthen their technical setups.
PET-D Indicator Trading Signals
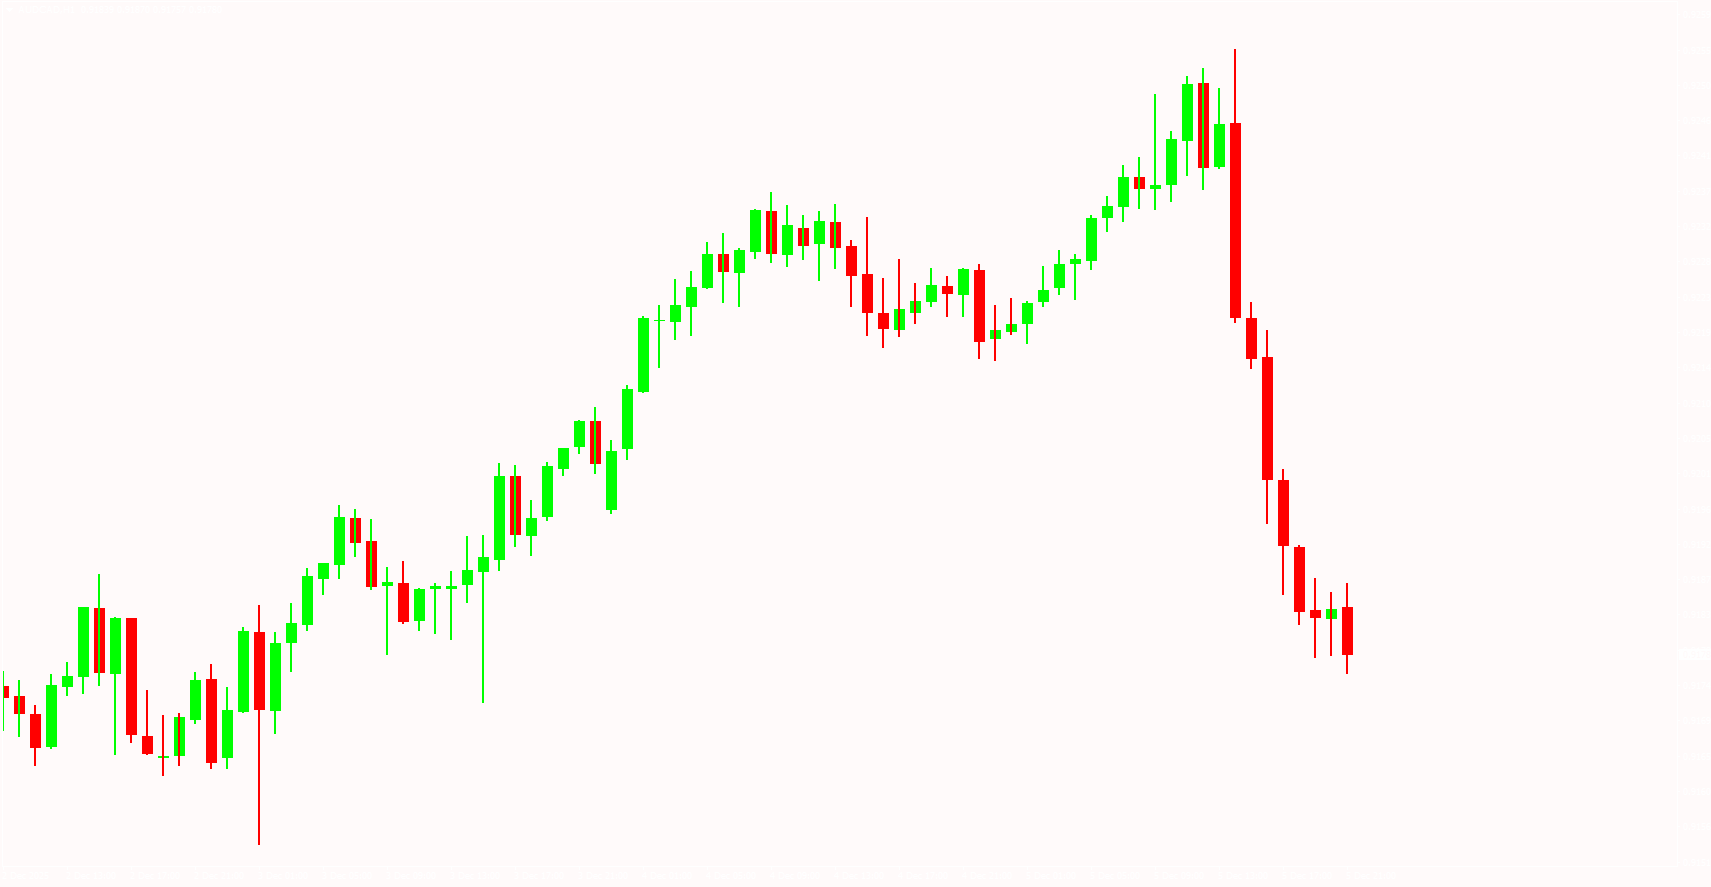
On the chart, bullish bars appear green, signaling upward momentum. Traders can enter BUY positions when green bars begin forming consistently. The recommended stop loss is usually placed below the previous swing low to protect against unexpected reversals.
Profit-taking is flexible, but a common approach is to exit the BUY trade when the PET-D bar color flips from green to red. This indicates a potential bearish shift and marks the end of the existing trend.
When the bar color changes from green to red, a bearish trend may be forming. This provides traders with a SELL signal. A stop loss above the previous swing high helps protect the trade, while profits can be taken once the bars change from red back to green or when a favorable risk-reward ratio is reached.
Using PET-D for Top-Down Analysis
One of the strongest ways to use the PET-D indicator MT4 is through top-down analysis. Larger time frames—such as D1 or W1—tend to produce more reliable and longer-lasting trends. By identifying the primary trend direction on higher time frames first, traders can then enter trades on lower time frames with higher probability.
For example:
Determine the main trend direction on the Daily chart using PET-D
Drop down to H1 or M30 for entry signals
Trade only in the direction of the higher-timeframe trend
This approach provides better alignment with market momentum and increases consistency across different trading sessions.
Best Practices When Trading With PET-D
While the PET-D indicator works well on its own, combining it with other tools enhances accuracy. Some effective confluence methods include:
Identifying support and resistance zones
Using trendlines and channels
Watching for candlestick confirmations
Applying moving averages for direction confirmation
Using volatility tools to avoid bad entries during price noise
Signals that occur near major technical levels or after clear pullbacks tend to produce the strongest outcomes.
Who Should Use the PET-D Indicator?
The PET-D indicator fits all trading levels:
Beginners benefit from its simplicity and color-based signals
Intermediate traders use it to validate trend direction
Advanced traders incorporate it into multi-indicator confirmation strategies
Scalpers, day traders, swing traders, and long-term traders can all apply the PET-D indicator effectively within their preferred strategies.
Conclusion
The PET-D indicator for MT4 is a powerful early trend detection tool that highlights bullish and bearish market phases using simple color coding. It works extremely well across all time frames and becomes even more effective when paired with other technical indicators. For best results, focus on signals near key support/resistance levels, trendlines, or channel boundaries.
To discover more reliable indicators and upgrade your trading tools, visit IndicatorForest.com.
FAQ
2 Downloads
Published:
Dec 06, 2025 01:58 AM
Category: