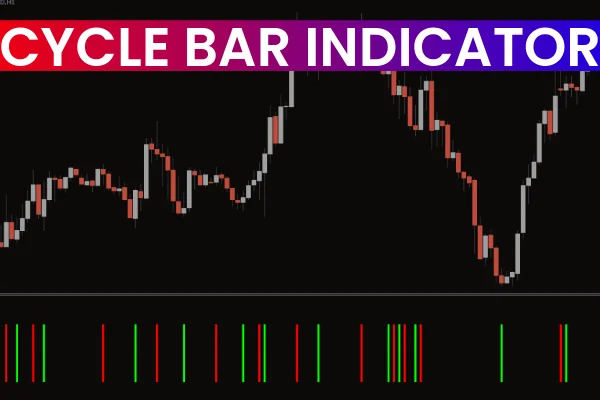
The Cycle Bar Indicator for MT4 displays color-coded bars in a subwindow beneath the price chart. These bars—colored red and green—are calculated using SMA (Simple Moving Average) and RSI, offering a visual representation of the current market cycle.
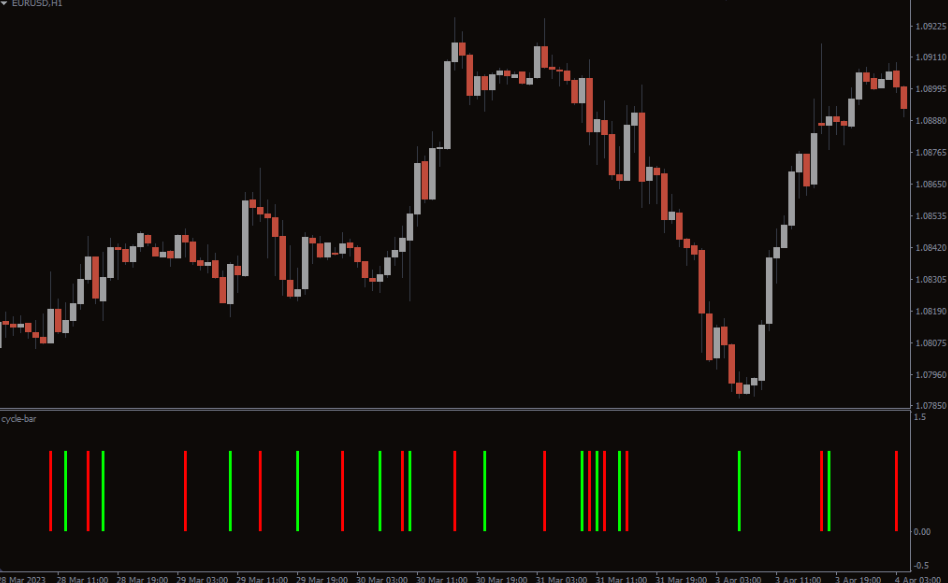
Green bars reflect a bullish candlestick, while red bars reflect a bearish candlestick, allowing traders to quickly identify the market’s directional bias. Because the indicator relies on price cycles, it performs best on higher timeframes. On lower timeframes, the tool may leave visible gaps between bars during low-volatility periods.
How to Use the Cycle Bar Indicator for MT4
The Cycle Bar Indicator does not generate direct buy or sell signals. Instead, it mirrors the strength and direction of the current candlestick:
Bullish candlestick → Green bar appears
Bearish candlestick → Red bar appears
At times, a bar may not appear exactly in sync with the candlestick’s color, which is why traders often combine this indicator with additional tools such as RSI, MACD, or moving averages for confirmation.
During sideways or consolidating markets, the indicator may not plot bars, creating small gaps that indicate low momentum or indecision in Price Action.
Conclusion
The Cycle Bar Indicator for MT4 helps traders understand market cycles by plotting red and green bars based on SMA and RSI calculations. While it does not produce explicit trade entries, it is an excellent tool for identifying trend direction and enhancing overall market awareness when paired with other indicators.
FAQ
1 Download
Published:
Dec 08, 2025 10:29 AM
Category: