The Candle Range Indicator for MT4 is a powerful volatility analysis tool that helps traders understand how much price fluctuates within each candlestick. By displaying these variations through a visual histogram, it offers a clear view of market momentum and volatility shifts. Whether you trade forex, indices, or commodities, the Candle Range Indicator helps you detect potential breakouts, trend reversals, and consolidation phases more effectively.

At IndicatorForest.com, we provide traders with professional tools like this one to enhance their decision-making and trading accuracy.
How the Candle Range Indicator Works
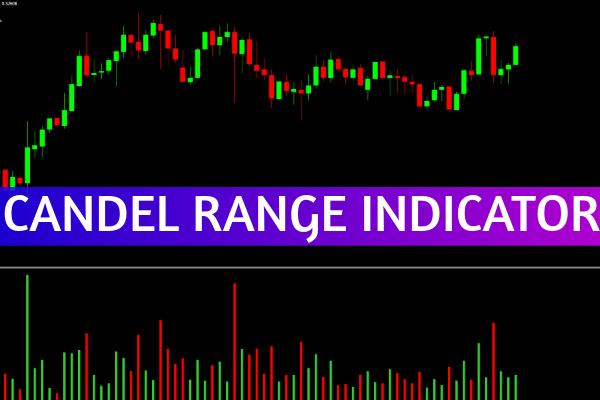
The Candle Range Indicator MT4 calculates the difference between the high and low of each candlestick within your selected time frame. These ranges are displayed as histogram bars below the main chart. The height of each bar represents the candle’s volatility:
Higher bars indicate strong price movement and increasing volatility.
Lower bars suggest reduced volatility and potential sideways markets.
By observing these fluctuations, traders gain a deeper understanding of market energy—helping them anticipate periods of expansion or contraction.
Candle Range Indicator Trading Signals
While the Candle Range Indicator does not produce direct buy or sell signals, it serves as an essential confirmation tool in technical analysis.
Here’s how you can interpret it:
Rising Histogram Bars: Increasing bar height often signals rising volatility, indicating strong market momentum. Such conditions frequently precede breakouts or trend continuations.
Falling Histogram Bars: Decreasing height reflects lower volatility, often preceding consolidation or trend exhaustion.
Sudden Spikes in Candle Range: A sharp jump in volatility can indicate a shift in market sentiment, often caused by news events or institutional trading.
Using this information, traders can confirm Trend Strength, filter out low-volatility periods, and refine entry and exit strategies.
Best Strategies for Using the Candle Range Indicator
Combine with Price Action
Price action traders can use the Candle Range Indicator to validate breakout setups. When candle ranges expand near key support or resistance levels, it often confirms the likelihood of a true breakout rather than a false one.
Use with Moving Averages
Pairing the indicator with moving averages (such as EMA or SMA) can help traders spot volatility-based trend continuations. For instance, a surge in candle range following a crossover indicates strong trend confirmation.
Identify Market Reversals
A rapid decline in candle ranges after a period of high volatility can suggest waning momentum, signaling a potential Trend Reversal or market pause.
Advantages of the Candle Range Indicator for MT4
Clear visualization of market volatility through histograms.
Easy integration into existing MT4 setups.
Supports multiple time frames, from Scalping to swing trading.
Helps detect market transitions from calm to active phases.
Improves trade timing by aligning entries with high-volatility moves.
These features make it a valuable tool for traders who rely on volatility-based strategies or momentum analysis.
Why Download from IndicatorForest.com
At IndicatorForest.com, we specialize in providing tested and reliable MetaTrader 4 indicators designed to enhance your market analysis. Our library includes tools for trend analysis, momentum tracking, and volatility measurement—all built with precision and ease of use in mind.
By downloading the Candle Range Indicator for MT4 from our site, you’ll gain access to an accurate, user-friendly tool that complements a wide range of trading strategies.
Conclusion
The Candle Range Indicator for MT4 is an indispensable volatility analysis tool that helps traders monitor price dynamics, identify momentum shifts, and prepare for major market moves. While it doesn’t issue direct buy or sell signals, it provides critical insights that improve overall trade timing and risk management.
Enhance your trading strategy today—download the Candle Range Indicator for MT4 from IndicatorForest.com and start analyzing volatility like a professional!
59 Downloads
Published:
Oct 31, 2025 14:40 PM
Category: