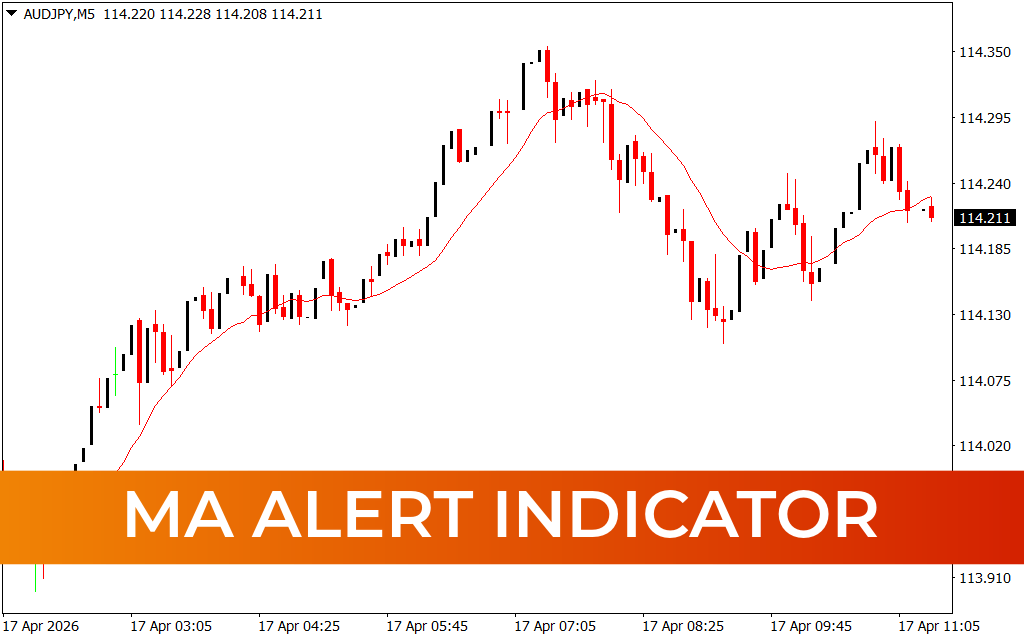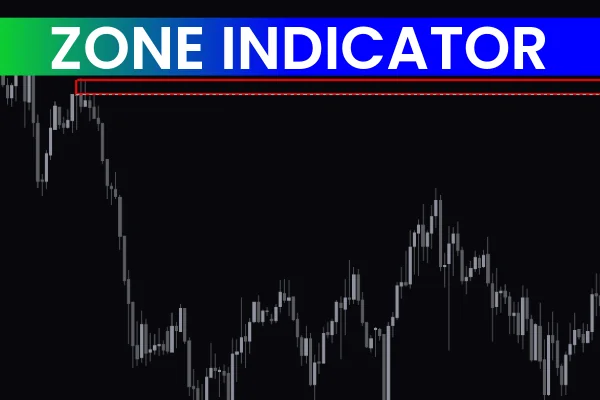
The Zone Indicator for MT4 is a highly accurate market-structure tool designed to automatically detect and plot major support and resistance zones. These levels help traders identify where price is likely to reverse, consolidate, or continue trending. By removing the need for manual drawing, the indicator improves chart clarity and allows traders to focus on high-probability trading opportunities.
The Zone Indicator works seamlessly with Price Action, candlestick analysis, wick rejection, and trend-based strategies. Its flexibility makes it suitable for scalping, day trading, and swing trading. Although it works across all MT4 timeframes, using it on higher timeframes provides greater precision.
Features of the Zone Indicator for MT4
Automatic Support & Resistance Zones
The indicator analyzes price structure and automatically plots meaningful Support And Resistance areas. Each zone is customizable, allowing traders to color-code them for improved visibility and workflow efficiency.
Simplified Chart Analysis
Manual support/resistance drawing can be inconsistent. The Zone Indicator instantly places accurate levels on the chart, helping traders save time and avoid drawing errors.
Fits All Trading Styles
Whether you scalp quick intraday moves or swing trade long trends, the Zone Indicator adjusts naturally to your approach. Its zone logic works on any strategy that relies on market structure.
Works on All MT4 Timeframes
From 1-minute to monthly charts, the indicator performs reliably. Higher timeframes (H4, D1) tend to generate stronger and more dependable zones.
Provides Buy & Sell Opportunities
The Zone Indicator becomes even more powerful when combined with wick rejection, price rejection, or candlestick patterns. These confirmations provide highly accurate BUY and SELL signals with strong risk-reward potential.
Customizable Settings
Users can personalize zone colors, style, sensitivity, and thickness. These settings improve chart readability and allow traders to adjust the indicator to their technical approach.
Fine-Tunable Technical Parameters
Advanced parameters let traders refine how the zones are detected and displayed. This flexibility makes the indicator effective for all trading conditions and currency pairs.
How the Zone Indicator Benefits You
The Zone Indicator is ideal for traders still learning how to plot strong support and resistance levels. It also benefits professional traders by removing repetitive manual work and ensuring consistent zone placement.
Zone-based strategies are among the most commonly used methods in trading because they rely on natural market behavior. This indicator ensures your zones are objective, clean, and updated automatically.
BUY Opportunity Using the Zone Indicator
Step-by-step:
Identify a support zone highlighted by the indicator.
Wait for price to retrace back into the zone.
Look for wick rejection or bullish candlestick formations signaling buyer strength.
Enter a BUY/LONG position once confirmation is visible.
This approach helps traders avoid impulse entries and only trade respected levels.
SELL Opportunity Using the Zone Indicator
Step-by-step:
Watch for a resistance zone plotted by the indicator.
Wait for price to revisit that resistance area.
Confirm rejection using upper wicks, bearish engulfing, or similar signals.
Enter a SELL/SHORT trade upon confirmation.
This method filters out weak setups and improves trade accuracy.
Call to Action
Enhance your forex trading strategy with premium MT4 indicators.
Visit IndicatorForest.com to download more powerful trading tools.
FAQ
13 Downloads
Published:
Dec 12, 2025 04:39 AM
Category: