Mastering Range and Trend Transitions: A Guide to the Stochastic with Flat Indicator
One of the greatest engineering hurdles for retail forex traders is dealing with indicator breakdown during strong, unidirectional trends. Traditional oscillators, like the standard Stochastic, are highly effective within range-bound markets, offering pinpoint accuracy when identifying overbought and oversold thresholds. However, the moment an asset enters an aggressive expansion phase, a classic oscillator will remain pinned at its extreme limits, generating a barrage of premature counter-trend signals. The Stochastic with Flat Indicator for MT4/MT5 solves this structural flaw by integrating an intelligent consolidation filter that flattens out erratic movements during sideways squeezes, offering day traders and scalpers pristine entries and accurate trend confirmations.
Analyzing Market Squeezes and Breakouts on EUR/USD M5
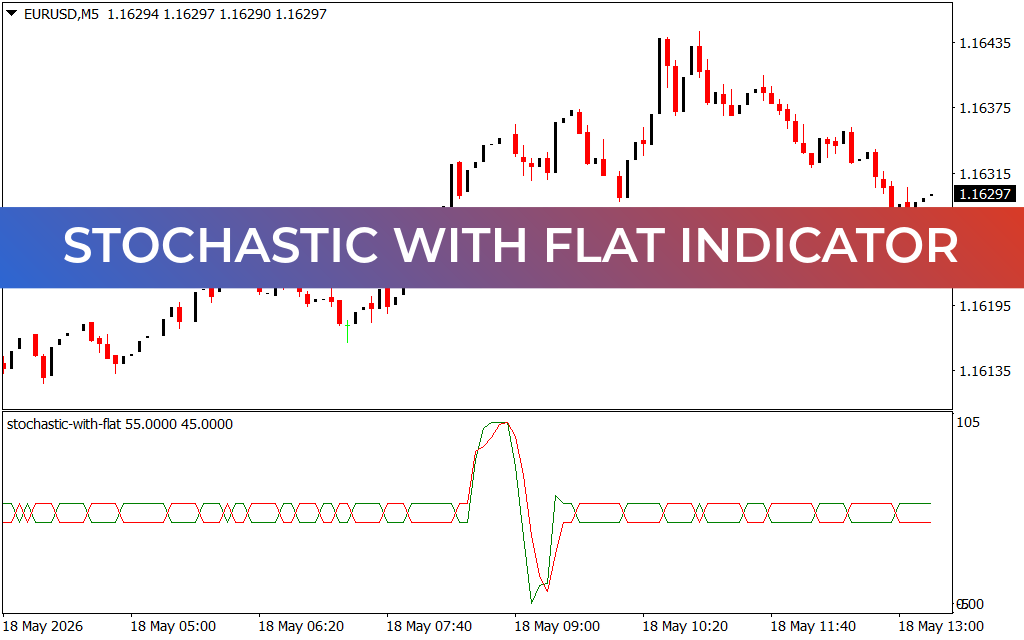
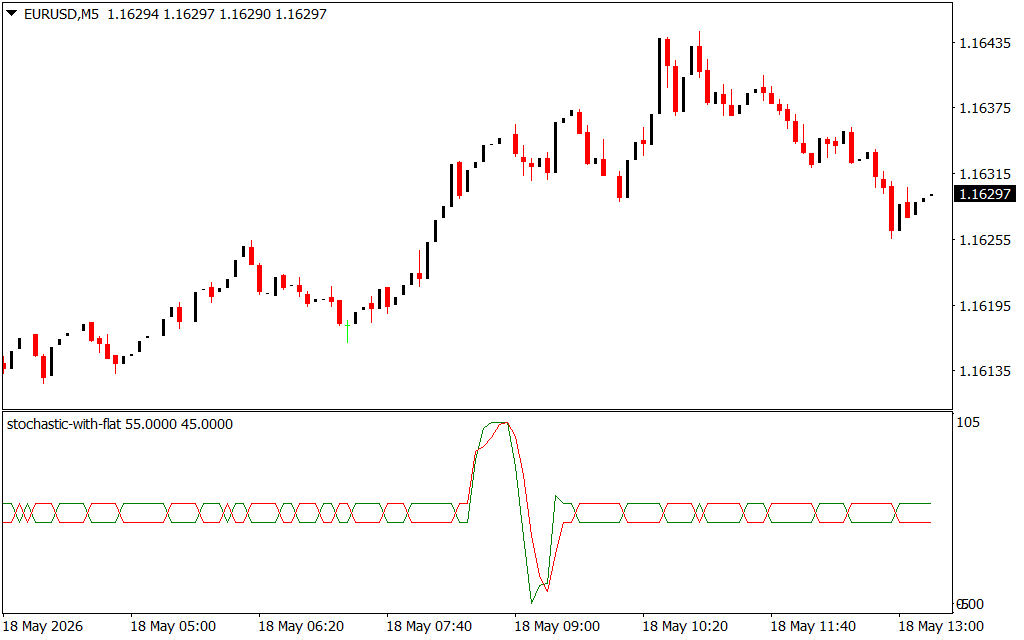
The provided EUR/USD 5-minute (M5) chart beautifully demonstrates how the Stochastic with Flat indicator handles both low-volatility compression and sudden momentum breakouts during an intra-day trading session. Located in the indicator sub-window, the tool utilizes dual green and red signaling lines oscillating across standard technical bounds.
During the early hours of May 18, the currency pair consolidated within a tight trading range, establishing a baseline liquidity floor near 1.16135. In a typical charting environment, standard oscillators fluctuate constantly back and forth, tempting high-frequency scalpers into low-probability setups.
Notice how the Stochastic with Flat indicator engine reacts here: it locks the green and red lines into a highly structured, interwoven horizontal grid between the 45.00 and 55.00 key levels. This deliberate flattening serves as a critical visual warning to traders that the market lacks true institutional directional conviction, protecting capital from being chopped up inside a flat range.
Capitalizing on Momentum Waves and Volatility Cycles
The true value of this advanced oscillator unfolds when the market transitions from a tight squeeze into an explosive trend. Following a brief test of structural support, buying pressure surged into the market around the 07:40 session mark.
As the Price Action broke past the 1.16195 zone, the flat baseline matrix ruptured. The green and red oscillator lines expanded rapidly upward, entering a clean cyclical wave that perfectly aligned with the massive vertical markdown and subsequent markup phases on the main chart field. The sharp, un-fragmented peak of the indicator lines confirmed that the bullish momentum was robust and supported by genuine volume, guiding traders to confidently hold long positions up toward the 1.16435 local swing high.
By using the Stochastic with Flat indicator in your daily workspace, you effectively remove the guesswork from oscillator analysis. It offers a clean, dual-state mapping system: a flat visual signature during dangerous sideways distributions, and a responsive momentum wave during structural breakouts. Whether you are Scalping quick pips on lower timeframes or tracking multi-session market structure, this tool provides the absolute clarity needed to stay aligned with large institutional shifts.
7 Downloads
Last Update:
May 18, 2026 16:22 PM
Published:
Jan 20, 2026 13:07 PM
Category: