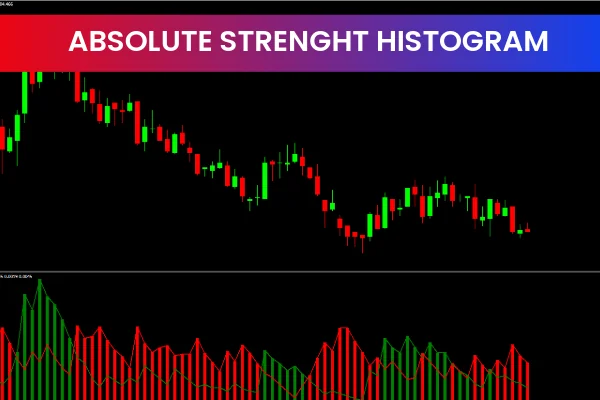
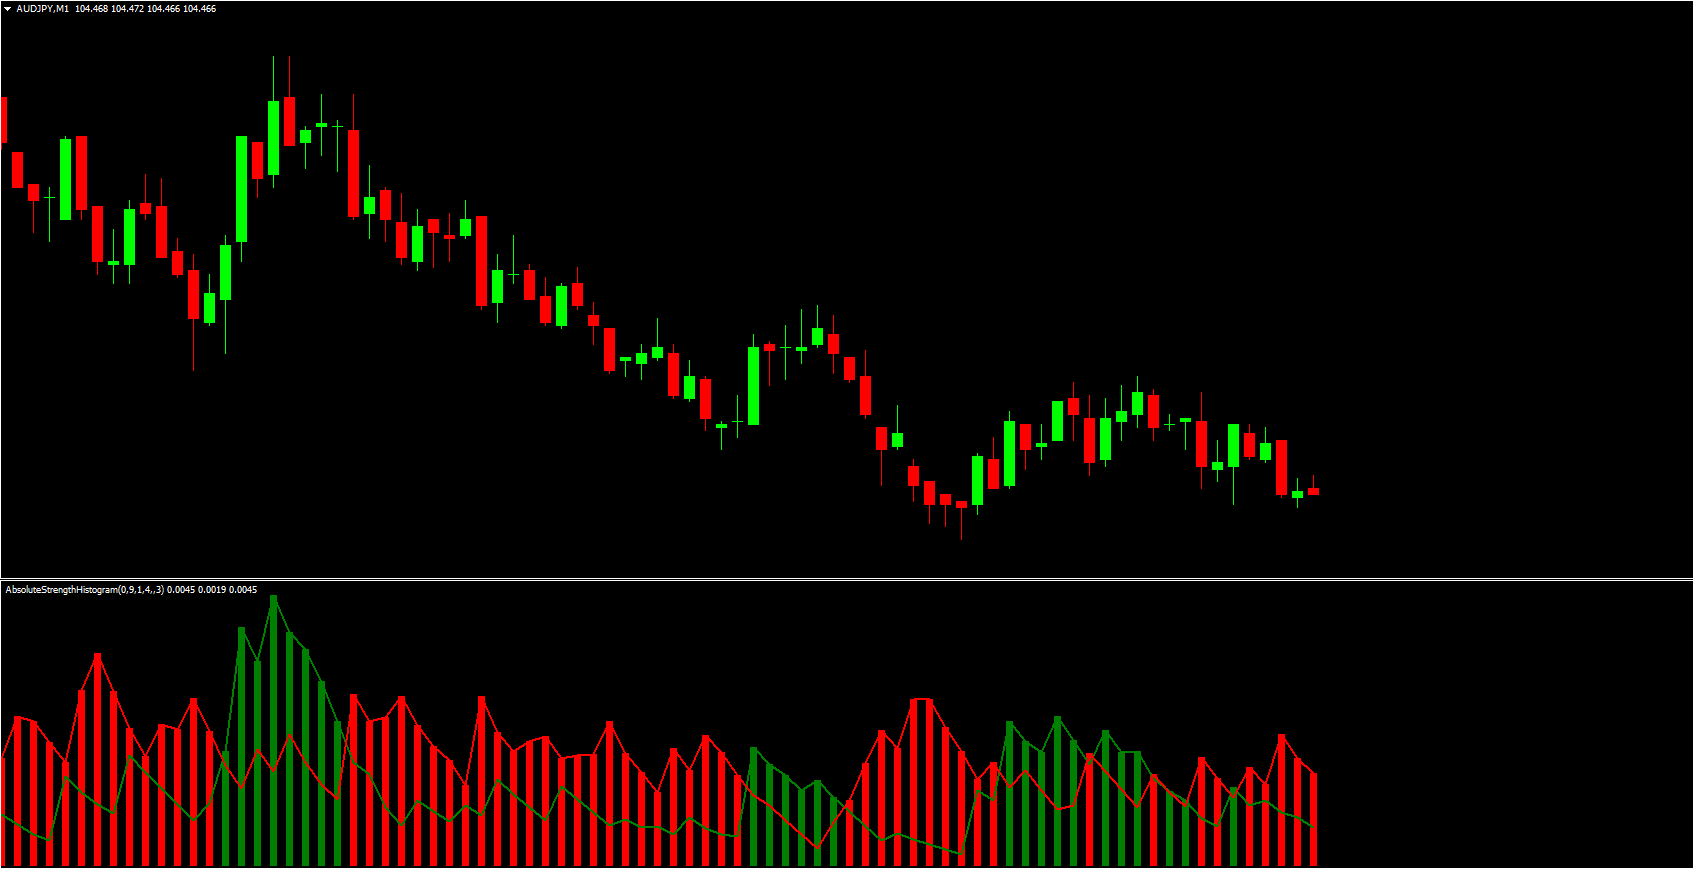
The Absolute Strength Histogram Indicator is a powerful and free Forex Indicator designed for the MetaTrader 4 (MT4) trading platform. It helps traders visualize both the strength and direction of a trend using a clear histogram display. By combining trend analysis with buy and sell signals, the indicator provides valuable insight into current market conditions.
This tool is suitable for traders of all experience levels and works effectively across various currency pairs and timeframes.
How the Absolute Strength Histogram Indicator Works
The Absolute Strength Histogram Indicator analyzes price movement to determine whether buyers or sellers are in control of the market.
Trend Strength Measurement
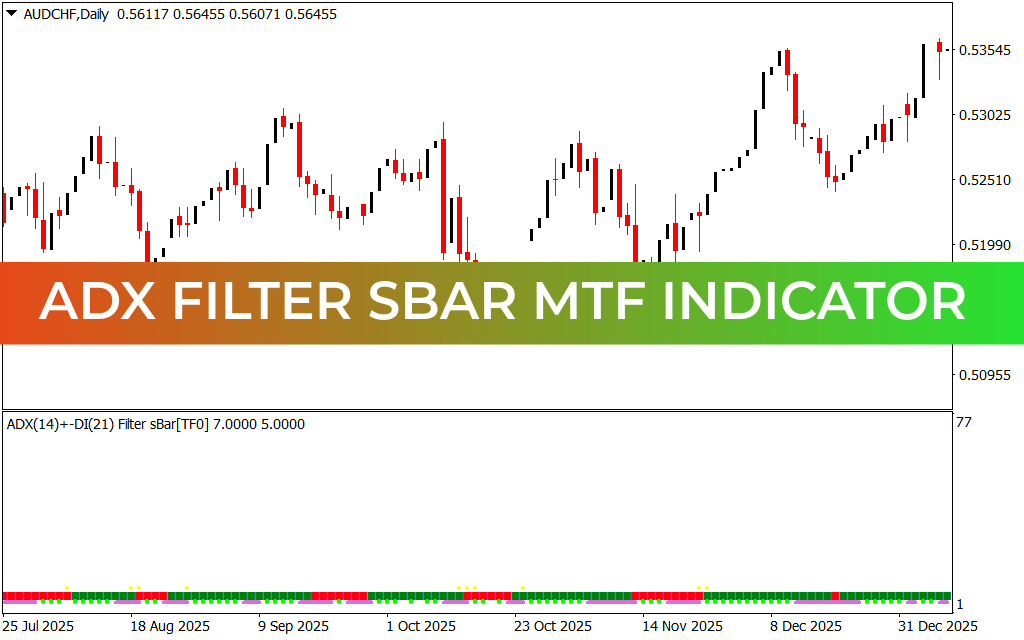
The histogram reflects the intensity of bullish or bearish momentum. Stronger histogram bars indicate increasing trend strength, while weaker bars may signal consolidation or a potential trend change.
Directional Signals
Bullish momentum is shown when histogram bars move in the positive direction
Bearish momentum appears when histogram bars shift in the negative direction
These changes help traders quickly assess market bias.
Key Features of Absolute Strength Histogram Indicator
Clear Histogram Visualization
The indicator displays trend strength in an easy-to-read histogram format, allowing traders to quickly interpret market momentum.
Buy and Sell Signal Support
Changes in histogram direction or strength can be used as entry and exit signals when aligned with the broader trend.
Multi-Timeframe Compatibility
The Absolute Strength Histogram Indicator works on all timeframes, making it suitable for Scalping, day trading, and swing trading.
Benefits of Using Absolute Strength Histogram Indicator
Traders gain several advantages by using this indicator:
Trend Confirmation: Validate whether a trend is strong or weakening
Improved Trade Timing: Identify potential entry and exit points
Reduced False Signals: Trade only when momentum supports the move
Beginner-Friendly: Simple visuals make trend analysis easier
Versatile Use: Works across Forex pairs and other financial assets
Trading Strategies Using Absolute Strength Histogram Indicator
Trend-Following Strategy
Trade in the direction of the histogram momentum. Buy during strong bullish readings and sell during strong bearish readings.
Momentum Shift Strategy
Watch for decreasing histogram strength as a warning of a possible Trend Reversal or consolidation phase.
Confluence Trading
Combine the indicator with Support And Resistance levels or moving averages to increase trade accuracy.
Best Practices for Trading with Absolute Strength Histogram Indicator
Use higher timeframes to confirm overall trend direction
Avoid trading during flat or low-momentum conditions
Combine with price action for stronger confirmations
Apply proper risk management on every trade
Educational resources from Investopedia and BabyPips provide deeper insights into trend strength and momentum analysis.
Why Traders Use Absolute Strength Histogram Indicator
The Absolute Strength Histogram Indicator is popular because it simplifies complex momentum analysis into a visual format that is easy to interpret. By clearly showing who controls the market and how strong the trend is, traders can make more confident and disciplined trading decisions.
Its free availability and effectiveness make it a valuable addition to any MT4 trading setup.
Enhance Your Trading with Absolute Strength Histogram Indicator
If you want to trade with a clearer understanding of trend direction and strength, the Absolute Strength Histogram Indicator is an excellent choice.
👉 Visit IndicatorForest.com to download the Absolute Strength Histogram Indicator and explore more professional Forex trading tools.
6 Downloads
Published:
Dec 24, 2025 14:14 PM
Category: