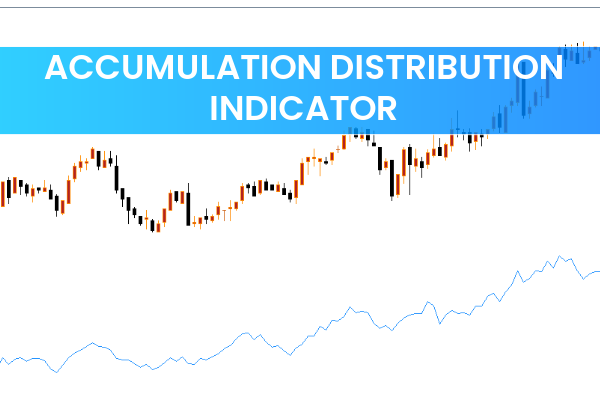
The Accumulation Distribution Indicator for MetaTrader 4 (MT4) is a powerful volume-based Trend Indicator that helps forex and stock traders evaluate the strength and weakness of market movements. By analyzing the relationship between price and trading volume, this indicator reveals whether a market is being accumulated (bought) or distributed (sold) — helping traders anticipate future trend direction and momentum shifts.
Whether you’re a beginner or a professional trader, understanding how to interpret the Accumulation Distribution line can give you a valuable edge in timing entries and exits more accurately.
How the Accumulation Distribution Indicator Works
The Accumulation Distribution (A/D) indicator measures the cumulative flow of volume and price changes over time. It essentially determines whether money is flowing into (accumulation) or out of (distribution) a security.
Accumulation: When buyers dominate and the price closes near its high, the indicator rises — showing increasing buying pressure.
Distribution: When sellers dominate and the price closes near its low, the indicator falls — signaling increasing selling pressure.
By comparing the movement of the A/D line with the actual price trend, traders can identify divergences and potential reversals before they happen.
How to Trade with the Accumulation Distribution Indicator in MT4
The Accumulation Distribution indicator can be used to identify Trend Continuation, momentum strength, and potential reversal points.
Here’s how to trade effectively using this indicator:
Confirm Trend Strength
When the A/D line is rising alongside the price, it indicates strong bullish momentum.
When the A/D line is falling with the price, it shows bearish pressure is increasing.
A steady rise in the indicator confirms that more traders are buying, supporting the ongoing uptrend.
Identify Divergences
If the price makes a new high but the A/D line does not, it signals weakening momentum and a possible Trend Reversal.
Similarly, if the price makes a new low but the A/D line rises, it may indicate that buyers are accumulating, suggesting an upcoming bullish reversal.
Use with Support and Resistance
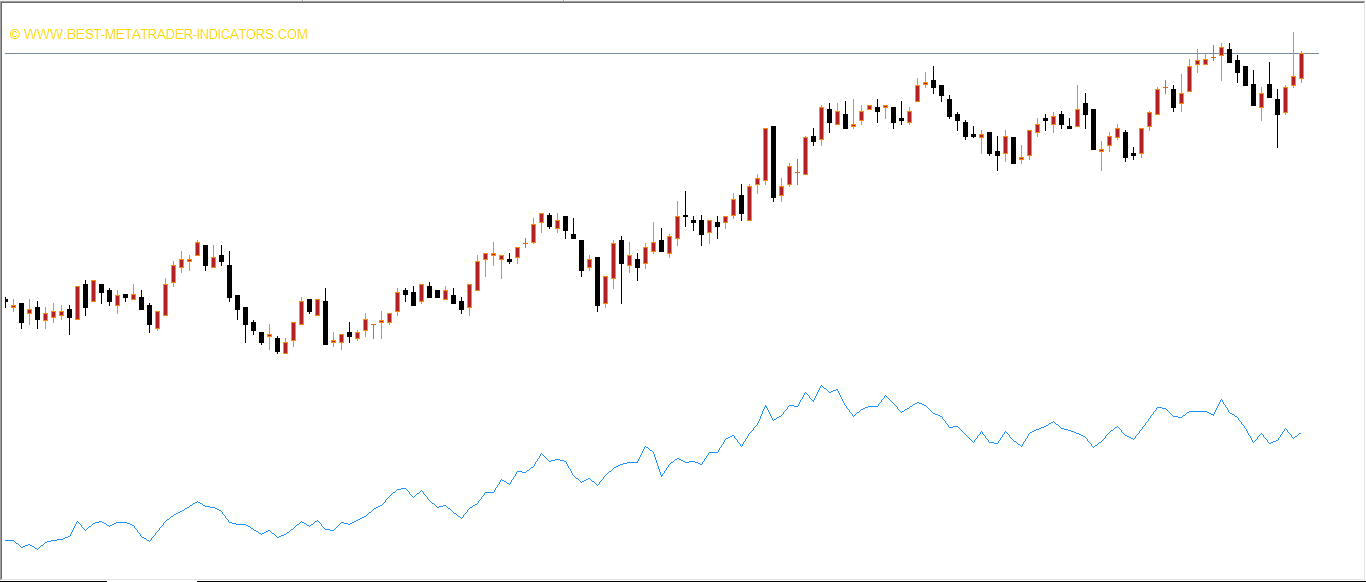
As shown in the GBP/USD 4-hour chart example:
When the price was initially trading below the resistance level of 1.34990, the A/D line remained flat. However, once the price broke above the resistance, the Accumulation Distribution line also exceeded its previous high, confirming a strong buy signal and validating the bullish breakout.
Why Use the Accumulation Distribution Indicator for MT4
The Accumulation Distribution Indicator is widely used because it combines Price Action with volume data, providing deeper insights into market sentiment. Here’s why traders rely on it:
Measures real market strength – identifies genuine buying or selling pressure.
Predicts trend reversals early – detects divergence between price and volume.
Easy to use and interpret – suitable for both new and experienced traders.
Works on all markets – forex, stocks, and commodities.
Compatible with other indicators – performs best when combined with RSI, MACD, or Moving Averages.
Pro Tips for Using Accumulation Distribution
Combine it with price action analysis for confirmation of entry and exit points.
Watch for divergences between the indicator and price to detect weakening trends.
Use it on higher timeframes (H4, Daily) for more reliable trend strength confirmation.
Pair it with momentum indicators like MACD and RSI for stronger trade validation.
Conclusion
The Accumulation Distribution Indicator for MT4 is one of the best trend strength tools available for both forex and stock traders. By analyzing the balance between price and volume, it helps you identify market momentum, potential reversals, and entry opportunities with clarity.
Simple yet powerful, this indicator can enhance your technical trading strategy — especially when used alongside other tools like MACD and RSI. Whether you’re trading breakouts, trends, or reversals, the Accumulation Distribution indicator provides the insight you need to make smarter trading decisions.
FAQ
The Accumulation Distribution Indicator measures buying and selling pressure by analyzing the relationship between price and volume. It helps identify whether money is flowing into or out of the market, providing insights into trend strength and potential reversals through volume-weighted price movements.
When the indicator line is rising, it indicates accumulation (buying pressure) and potential bullish momentum. When the line is falling, it suggests distribution (selling pressure) and potential bearish momentum. Divergences between price and the indicator can signal potential reversals.
The indicator helps confirm trend strength by showing whether volume supports price movement. Rising price with rising A/D confirms bullish momentum, while falling price with falling A/D confirms bearish momentum. This volume confirmation adds an important layer to price analysis.
Use the indicator to confirm trend direction and identify potential reversals through divergence. Enter trades when A/D confirms price movement, and watch for divergences that may signal trend exhaustion. Combine with price action patterns or support/resistance levels for better accuracy.
Yes, Accumulation Distribution works on all MT4 timeframes and currency pairs. It is suitable for scalping, day trading, and swing trading, though many traders find it most effective on H1 and H4 charts where volume patterns are clearer and more meaningful.
Published:
Nov 05, 2025 09:46 AM
Category: