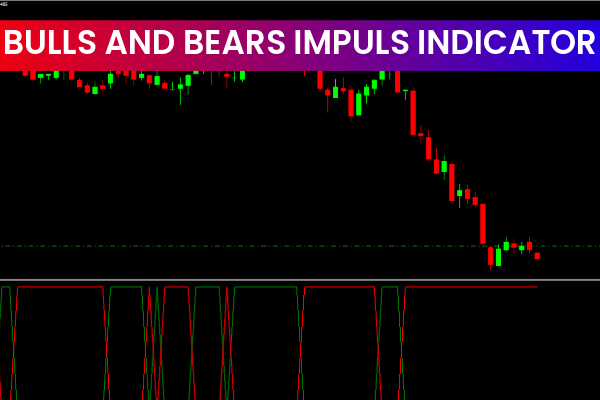
The Bears Bulls Impuls Indicator for MT4 is a momentum-based oscillator designed to measure the strength of buying and selling pressure in the market. Bullish momentum is calculated from the difference between the highest price and the moving average, while bearish momentum is derived from the difference between the lowest price and the moving average.
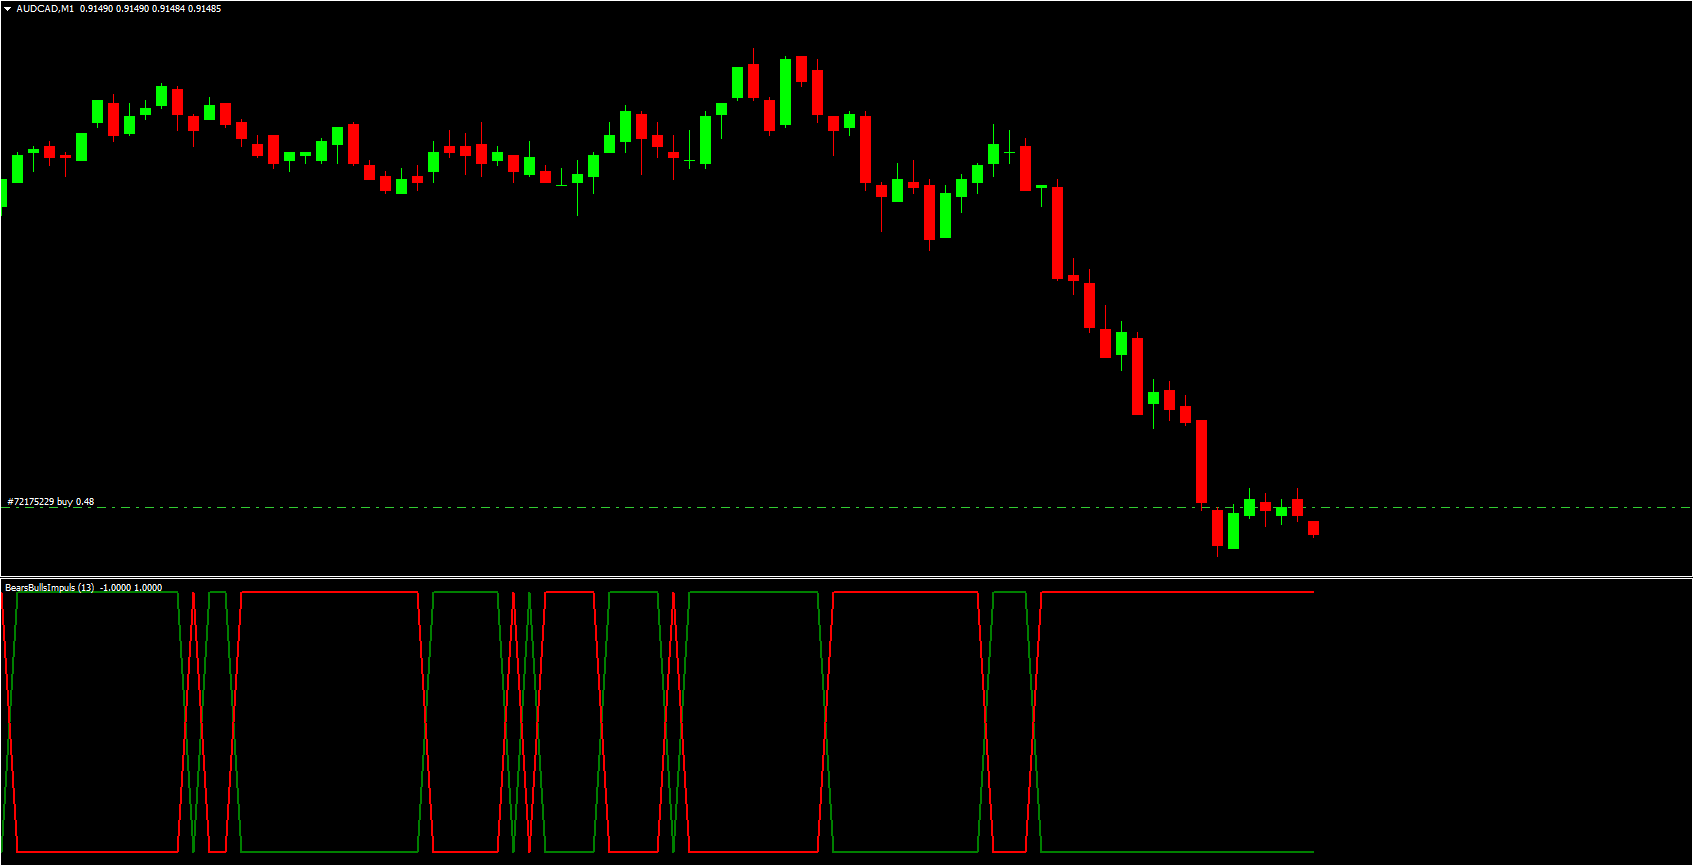
These calculations help traders determine whether buyers (bulls) or sellers (bears) currently control the market. The indicator plots green lines for bull power and red lines for bear power, giving users a clear visual representation of market sentiment shifts.
How to Trade with the Bears Bulls Impuls Indicator
The indicator displays short-term momentum changes through the interaction of the green (bull) and red (bear) lines.
Trading signals include:
Green line crossing above red line → increasing bullish momentum → potential buy opportunities
Green line crossing below red line → rising bearish momentum → potential sell opportunities
These signals become more reliable when combined with other tools such as trendlines, moving averages, or candlestick patterns like bullish or bearish engulfing formations.
The indicator helps traders time entries more accurately by visually revealing which side has stronger market influence.
Conclusion
The Bears Bulls Impuls Indicator for MT4 offers a clear and objective way to evaluate market sentiment by comparing bullish and bearish power. Its crossover signals help traders make informed decisions, especially when used alongside other technical confirmation tools.
FAQ
2 Downloads
Published:
Dec 08, 2025 10:20 AM
Category: