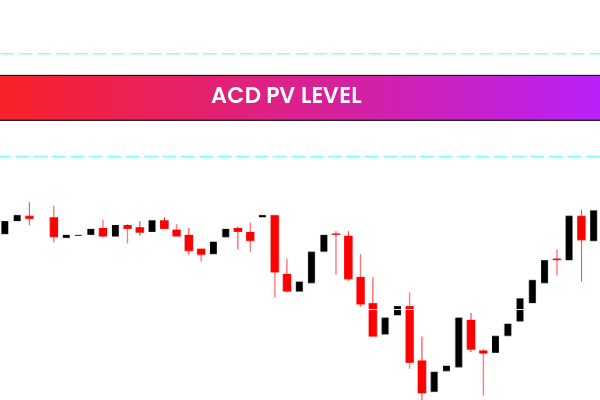
The ACD PV Levels Indicator is a popular and effective free Forex Indicator designed for the MetaTrader 4 platform. This indicator is widely used by traders who want to identify potential trading opportunities based on market volatility and price distribution. By combining the Average True Range and Accumulation Distribution concepts, the indicator provides clear insights into overbought and oversold market conditions.
The ACD PV Levels Indicator is suitable for both beginner and advanced traders, offering a balance between simplicity and analytical depth.
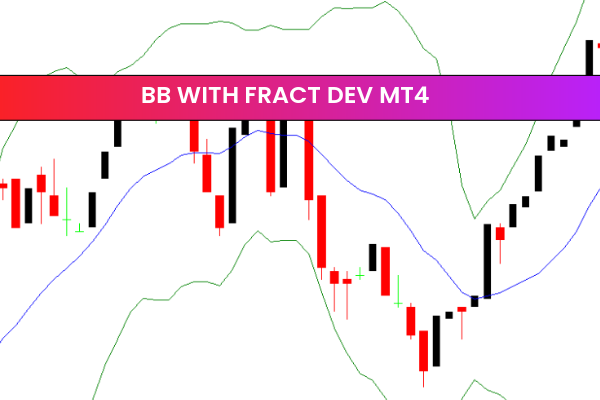
What Is the ACD PV Levels Indicator
The ACD PV Levels Indicator is a technical analysis tool that blends two important market measurements: volatility and price flow. It uses Average True Range values to assess market movement strength and Accumulation Distribution calculations to evaluate buying and selling pressure.
By analyzing these components together, the indicator helps traders understand whether price levels are stretched too far in one direction, signaling possible reversals or pullbacks.
How the Indicator Works
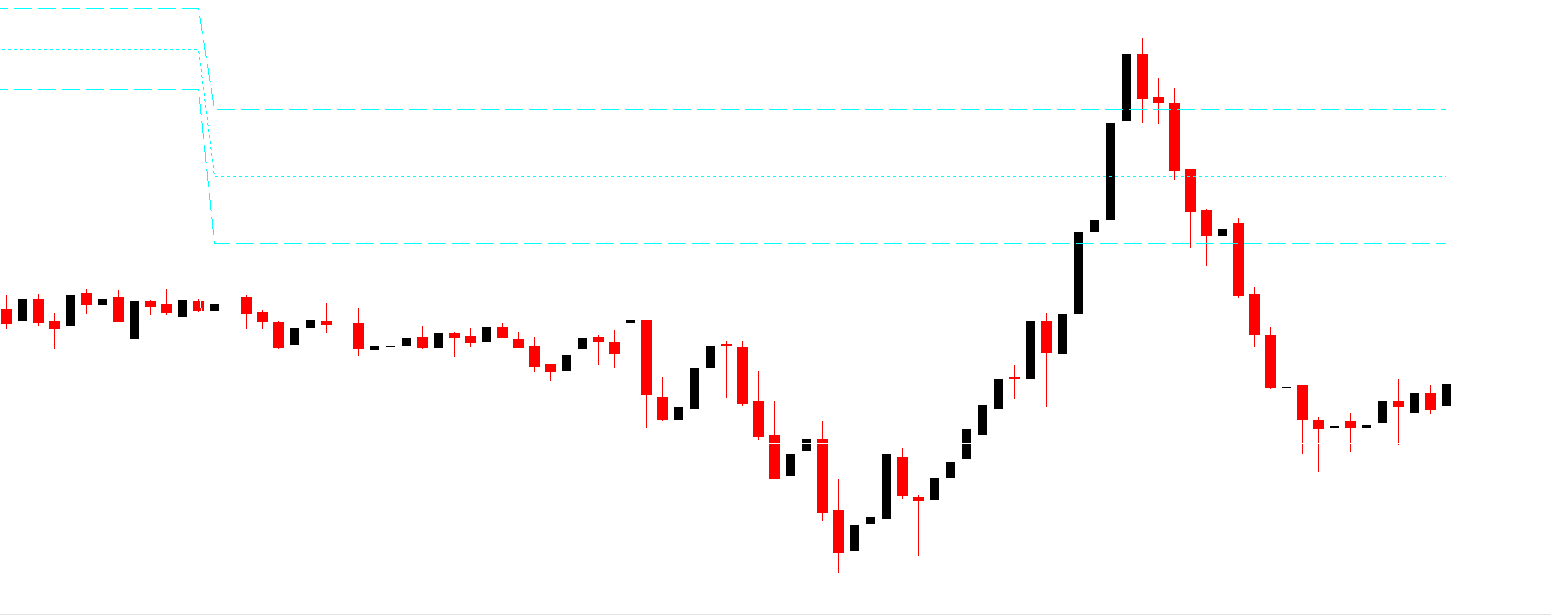
The ACD PV Levels Indicator analyzes the Price Action of a currency pair and plots calculated levels directly on the chart. The Average True Range is calculated using the average of high, low, and closing prices over a selected period. This provides a reliable measure of market volatility.
The Accumulation Distribution value is derived from price movement between the open and close. When these two values interact, the indicator generates visual levels that highlight potential buy and sell zones. These zones can act as early warnings of market exhaustion.
Identifying Overbought and Oversold Conditions
One of the key strengths of the ACD PV Levels Indicator is its ability to identify overbought and oversold areas. When price reaches extreme levels relative to ATR and ACD values, it may indicate that the market is due for a correction.
Traders often use these conditions to:
Prepare for potential trend reversals
Avoid entering trades at unfavorable prices
Look for confirmation signals using price action
This makes the indicator especially useful in ranging and volatile market conditions.
Support and Resistance Level Detection
In addition to momentum signals, the ACD PV Levels Indicator helps identify potential Support And Resistance zones. These levels are derived from historical price behavior and volatility ranges, offering traders logical areas where price may react.
Support and resistance levels can be used to place stop-loss orders, define profit targets, and improve overall trade management. When combined with other technical tools, these levels become even more reliable.
Entry and Exit Point Assistance
The indicator provides traders with visual guidance for potential entry and exit points. Buy signals may appear when price moves into oversold zones, while sell signals may form when price enters overbought areas.
Traders often wait for confirmation from candlestick patterns or trend direction before entering trades. This disciplined approach helps reduce false signals and improves consistency.
Easy to Use and Beginner Friendly
Despite its analytical power, the ACD PV Levels Indicator features a clean and easy-to-use interface. It installs quickly on the MT4 platform and does not overcrowd the chart. The plotted levels are clear and simple to interpret.
This makes it an excellent choice for novice traders learning market structure, as well as experienced traders looking for a reliable confirmation tool.
Why Traders Use the ACD PV Levels Indicator
The ACD PV Levels Indicator stands out because it combines volatility analysis with price distribution logic. Being free to use and compatible with MT4 makes it accessible to traders worldwide.
If you are looking to enhance your trading strategy with a reliable and user-friendly indicator, explore the ACD PV Levels Indicator and many other professional tools available at IndicatorForest.com.
1 Download
Published:
Jan 08, 2026 09:12 AM
Category: