Precision Trading with the Adaptable Stochastic RSI Indicator
In the competitive world of Forex and stock trading, timing is everything. Traders are constantly seeking tools that can filter out market noise and provide clear signals for entry and exit points. The Adaptable Stochastic RSI Indicator is a cutting-edge technical analysis tool designed for MT4 and MT5 platforms that combines the best of two worlds: the trend-following capabilities of the Relative Strength Index (RSI) and the sensitivity of the Stochastic Oscillator.
What is the Adaptable Stochastic RSI?
The Adaptable Stochastic RSI is a "momentum of momentum" indicator. While a standard RSI measures the speed and change of price movements, applying the Stochastic formula to that RSI data creates a much more responsive tool. The "Adaptable" component refers to its ability to adjust to current market volatility, ensuring that the overbought and oversold levels remain relevant whether the market is ranging or trending strongly.
Key Features and Benefits
- Enhanced Sensitivity: By calculating the Stochastic of the RSI, this indicator identifies cyclical turns much faster than a traditional RSI alone.
- Volatility Adaptation: It dynamically adjusts to market conditions, reducing the number of "fakeout" signals during periods of low liquidity.
- Clear Visual Signals: The indicator features two lines—a fast line and a slow signal line—making it easy to spot crossovers that indicate shifts in momentum.
- Versatile Timeframes: Whether you are engaged in 5 minutes Scalping or daily swing trading, the settings can be tuned to fit your specific strategy.
Trading Strategies and Practical Use
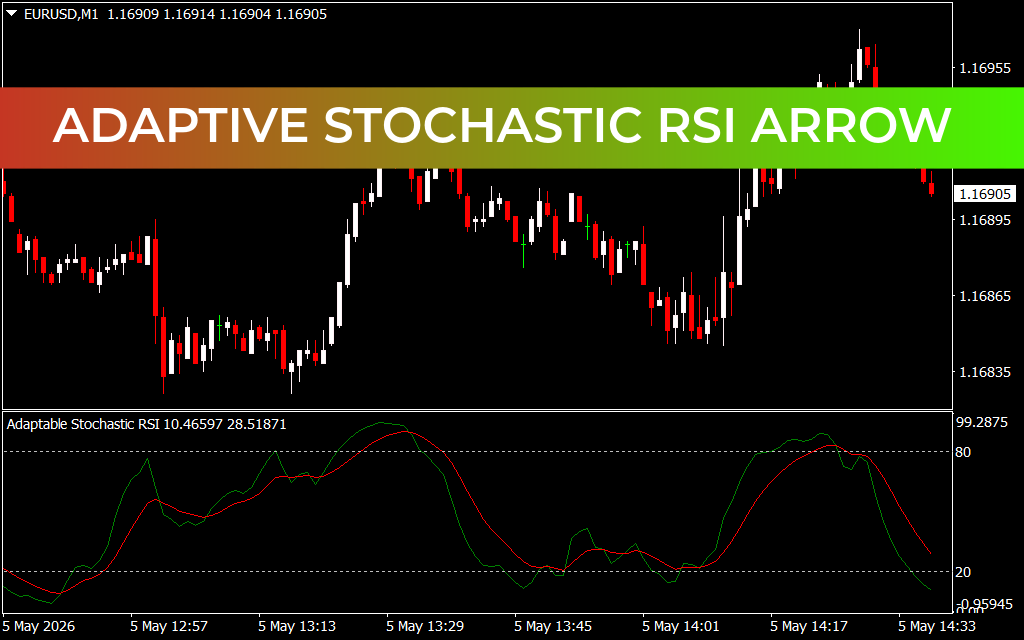
As shown in the file EURUSDM1_4.png, the Adaptable Stochastic RSI operates in a sub-window below the price chart. Traders typically look for two primary types of signals:
- Overbought/Oversold Reversals: When the lines cross above the 80 level (overbought) and head back down, it signals a potential sell opportunity. Conversely, a cross below the 20 level (oversold) heading up suggests a buy opportunity.
- Signal Line Crossovers: A bullish crossover (the green line crossing above the red line) in an oversold region provides a strong confirmation for long entries.
This indicator is highly effective when paired with Price Action analysis. For instance, if the price reaches a major resistance zone and the Adaptable Stochastic RSI confirms an overbought condition, the probability of a successful short trade increases significantly.
Why You Should Use This Indicator
Standard oscillators often get "stuck" at extremes during strong trends. The Adaptable Stochastic RSI is engineered to stay fluid, providing exit signals even in high-momentum environments. For traders focused on momentum trading and technical analysis, this tool is an essential upgrade over default platform indicators, offering a more refined perspective on market strength.
5 Downloads
Last Update:
May 05, 2026 17:39 PM
Published:
Jan 27, 2026 19:49 PM
Category: