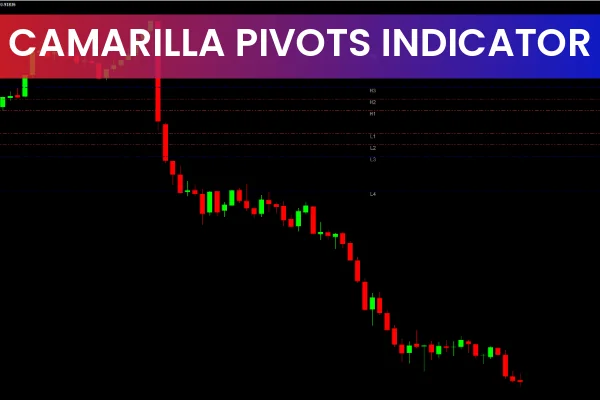
The Camarilla Pivots Indicator for MT4 is a powerful tool that automatically calculates precise support and resistance levels using the previous day's Price Action. It includes one main pivot point, four support levels, and four resistance levels, giving traders a reliable roadmap for intraday trading.
This guide explains how the indicator works, what each level means, and how to use it effectively in both trending and sideways markets.
What Is the Camarilla Pivots Indicator?
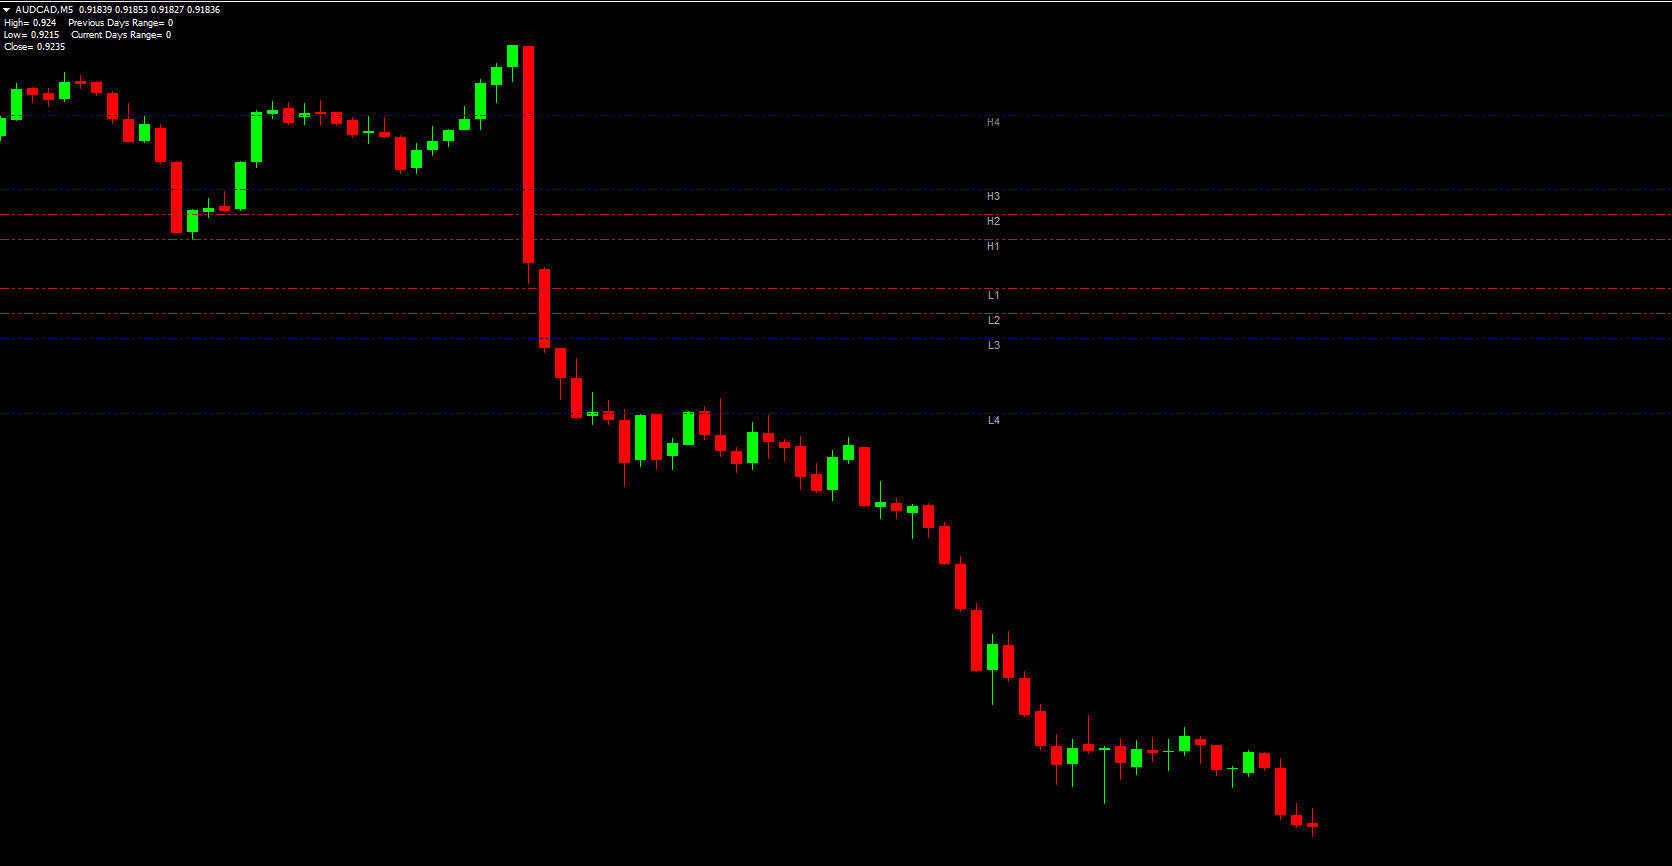
The Camarilla Pivots Indicator plots multiple layers of support (CL1–CL4) and resistance (CH1–CH4) based on:
H – Previous day’s high
L – Previous day’s low
C – Previous day’s close
Among these levels, the most critical ones are:
CL3 & CH3 – Breakout levels (trade with the trend when broken)
CL4 & CH4 – Reversal levels (trade against the trend at extremes)
This multi-layered system helps identify potential reversal zones, breakout opportunities, and Trend Continuation points.
How to Use the Camarilla Pivots Indicator
The indicator is effective for both trend trading and range trading. Trading decisions are often made based on where the market opens for the next day or session.
If the market opens near support levels → look for buy opportunities.
If it opens near resistance levels → look for sell opportunities.
For bullish traders, the indicator highlights clean support-based buy zones. For bearish traders, it highlights optimal reversal areas to sell from.
Camarilla Pivot Trading Strategy
During trending conditions, the indicator becomes highly valuable for timing entries.
Use CL3/CL4 levels in an uptrend and CH3/CH4 levels in a downtrend.
FAQ
Published:
Dec 05, 2025 12:43 PM
Category: