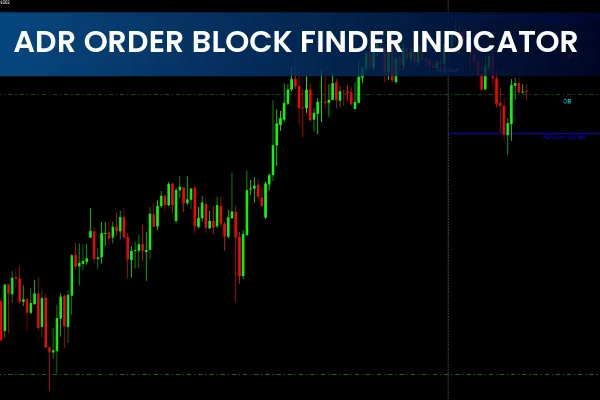
In fast-moving forex markets, traders rely on tools that help them understand Trend Strength, direction, and potential reversals. The ADR Order Block Finder Indicator is a simple yet powerful MT4 indicator designed to measure the advance and decline order ratio (ADR). Unlike traditional tools that depend solely on price or volume, this indicator focuses on the relationship between bullish and bearish activity, allowing traders to gauge which side of the market is dominant at any moment.
The classic ADR indicator compares the previous day’s orders with the current day’s price activity to determine the average distance between highs and lows. The ADR Order Block Finder Indicator, however, measures the average difference between the highest and lowest prices over a selected period, giving traders a clearer sense of market volatility and directional strength. This makes it particularly effective for spotting short-term price shifts.
How the ADR Order Block Finder Indicator Works
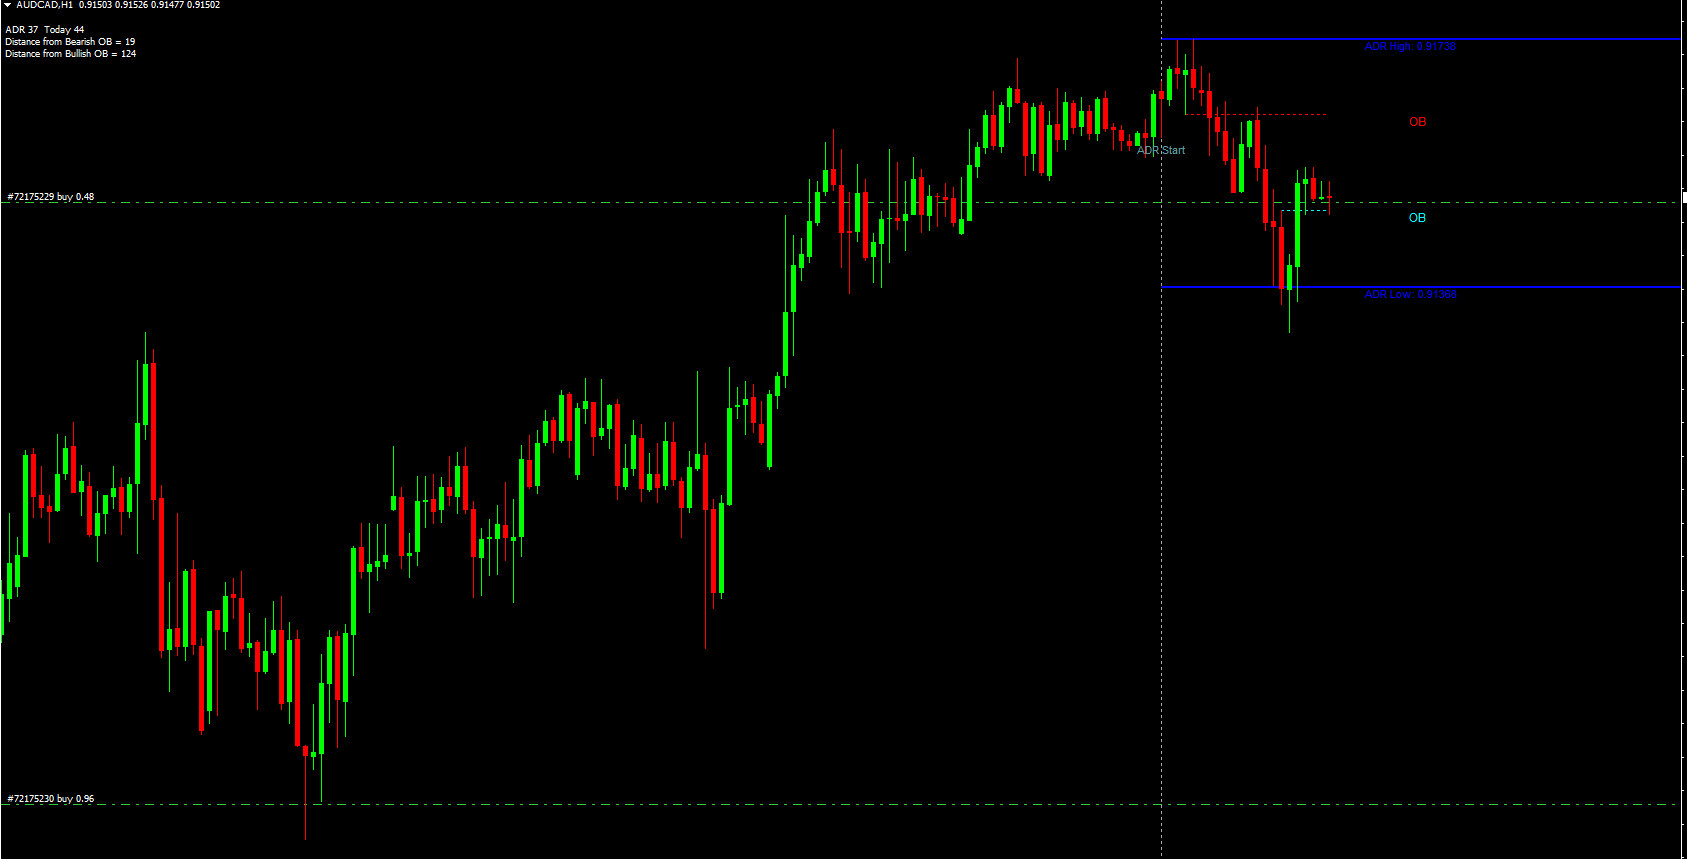
The indicator plots two lines on the chart:
Blue Line – Shows bullish activity
Red Line – Shows bearish activity
These lines represent the dynamic distance between bullish and bearish pressures. By evaluating how far apart these lines are—and which one is dominant—traders can better identify whether the market is more likely to move upward or downward.
The ADR Order Block Finder Indicator works best on shorter timeframes, such as:
M30 (30-minute chart)
H1 (1-hour chart)
On these timeframes, order flow imbalances tend to appear more clearly and produce more actionable insights.
Understanding the ADR Concept
ADR (Average Daily Range) traditionally measures the distance between the previous day's high and low. By comparing this with the current day’s movement, traders can anticipate market volatility. The ADR Order Block Finder Indicator adapts this idea to reveal the average difference between bullish and bearish momentum.
When the indicator shows a dramatic expansion between the blue and red lines, it often signals a short-term shift in market activity, such as:
A new trend forming
Increased volatility
Momentum acceleration
Order block creation
These insights help traders refine their entry and exit strategies.
ADR Order Block Finder Indicator BUY/SELL Logic
Although the indicator does not provide direct BUY/SELL arrows, it gives a reliable framework to assess trend direction:
When to Consider BUY (Long) Positions
If the bullish (blue) lines are higher or more dominant, it suggests that upward pressure is increasing. Traders can interpret this as the start or continuation of an uptrend.
Look for:
Blue lines rising steadily
Blue > Red
Market approaching or breaking previous bullish ADR levels
When to Consider SELL (Short) Positions
If the bearish (red) lines dominate, the market is likely entering a downward trend. Increased red line activity reflects selling pressure and weakening bullish momentum.
Look for:
Red lines rising above blue
Red > Blue
Price reacting to bearish ADR zones
Using the Indicator With Other Tools
To generate reliable trading signals, the ADR Order Block Finder Indicator should be combined with momentum or confirmation indicators such as:
RSI (Relative Strength Index)
MACD (Moving Average Convergence Divergence)
Volume Profile tools
Support And Resistance levels
This combination helps traders confirm whether bullish or bearish strength is genuine or temporary.
Why Traders Use the ADR Order Block Finder Indicator
Simple Interpretation
No complicated settings. The two-line system makes it easy to identify which force—bullish or bearish—is stronger.
Ideal for Short-Term Trading
Traders operating on M30 or H1 charts benefit from clear intraday trend direction.
Useful for Identifying Order Blocks
When the distance between the lines expands sharply, it may indicate accumulation or distribution zones.
Helps Predict Trend Shifts
Sudden movement in the ADR can reveal potential reversals before they appear in price.
Conclusion
The ADR Order Block Finder Indicator for MT4 offers valuable insight into the distance between bullish and bearish activity using the advance–decline ratio. By comparing previous and current price ranges, traders can identify trend strength and determine when to enter long or short positions. When paired with additional confirmation tools, this indicator becomes a reliable part of a trader’s analysis toolkit.
You can download the ADR Order Block Finder Indicator for free at IndicatorForest.com to improve your intraday trading accuracy and market understanding.
FAQ
3 Downloads
Published:
Nov 30, 2025 13:42 PM
Category: