Maximize Trading Accuracy with the Advanced RSI Histo V1 for MT4
The Relative Strength Index (RSI) has long been a staple of technical analysis, but standard line oscillators can sometimes be difficult to interpret during fast-paced market expansions. The Advanced RSI Histo V1 for MetaTrader 4 (MT4) evolves this classic formula into a powerful histogram-based tool. By visualizing momentum through color-coded bars rather than a single moving line, it allows traders to spot institutional buying and selling pressure with far greater clarity.
The Evolution of RSI Analysis
The Advanced RSI Histo V1 takes the core mathematical principles of the RSI—measuring the velocity and magnitude of directional price movements—and enhances them with several key features:
- Histogram Visualization: Momentum is plotted as vertical bars above and below a central zero line. This makes it instantly obvious whether the bulls or bears are in control of the current candle.
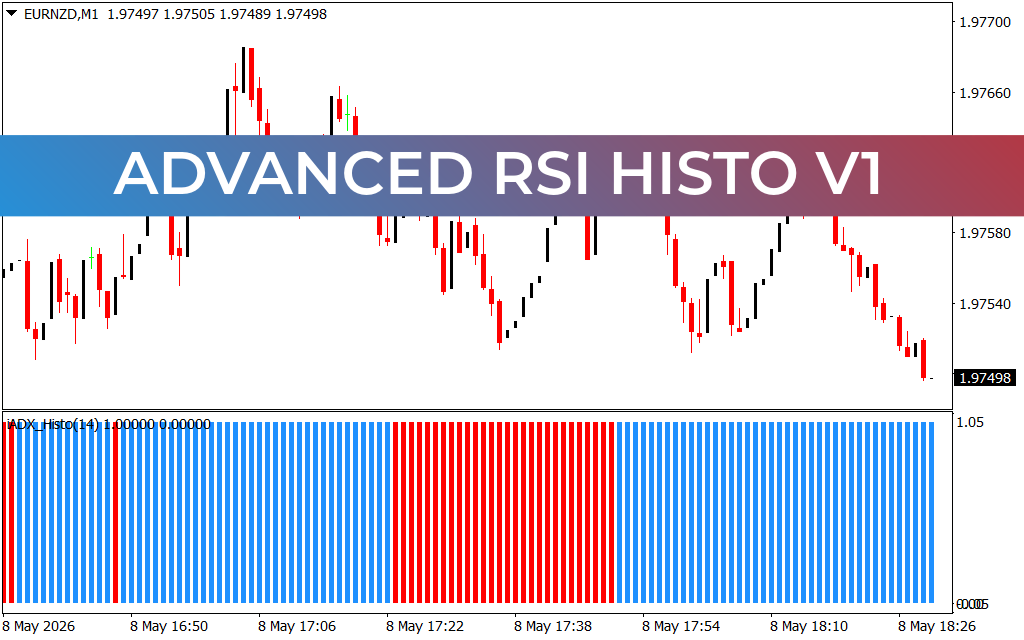
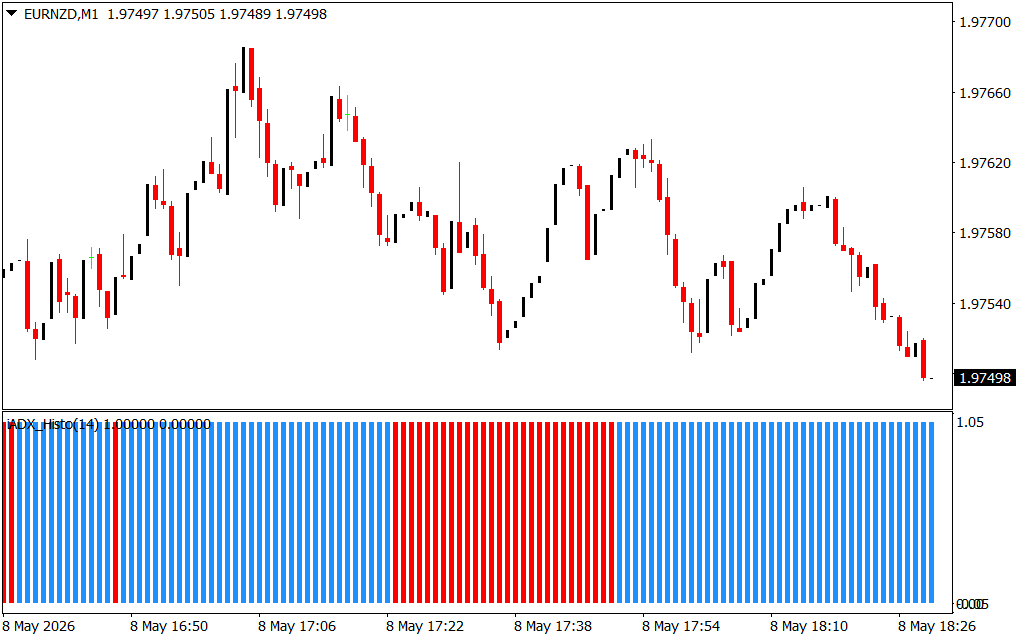
- Color-Coded Momentum: The bars change color based on the strength of the move. As seen on the EURNZD M1 chart, bright green bars signify strong upward momentum, while deep red bars indicate aggressive selling pressure.
- Dynamic Overbought/Oversold Zones: The indicator maintains the classic 70/30 or 80/20 threshold logic, but the histogram format makes it easier to see exactly how long a price stays in an overextended state before a reversal begins.
Strategic Benefits for MT4 Day Traders
- Spotting Divergence Early: One of the most powerful uses of this tool is identifying hidden divergence. If price makes a higher high while the RSI Histogram makes a lower peak, it signals that the trend is losing internal strength and a reversal is imminent.
- Improved Scalping Timing: For M1 and M5 scalpers, timing is everything. The Advanced RSI Histo V1 filters out the "jagged" noise of a standard line oscillator, providing a smoother representation of momentum that helps traders stay in winning trades longer.
- Zero-Line Cross Signals: A move from the negative zone to the positive zone (crossing the zero line) is a high-probability signal that market sentiment has flipped, often serving as a reliable entry trigger for trend-following strategies.
- Reduced Visual Fatigue: Trading for hours can be taxing. The histogram format is much easier on the eyes and allows for "at-a-glance" decision-making, which is critical during high-volatility sessions.
How to Trade with Advanced RSI Histo V1
The most effective strategy with this indicator is the Momentum Rejection method. Traders look for the histogram to reach an extreme peak (the overbought or oversold zone) and then wait for the bars to begin shrinking back toward the zero line. This "hook" indicates that the extreme pressure has faded, providing a low-risk entry point for a counter-trend move.
In the provided chart, notice how the histogram accurately reflects the impulsive price swings on the 1-minute timeframe. By combining these signals with key Support And Resistance levels, you can filter out false breakouts and focus on moves backed by genuine momentum. Whether you are a beginner or a professional, the Advanced RSI Histo V1 provides the analytical edge needed to master today's complex Forex markets.
1 Download
Last Update:
May 08, 2026 21:32 PM
Published:
Jan 25, 2026 17:37 PM
Category: