Precision Swing Mapping: Mastering Key Structural Pivots with the 3 Bars High Low Indicator
In technical analysis, identifying valid Support And Resistance levels is the cornerstone of any profitable trading strategy. However, retail traders often struggle with subjectivity, drawing lines across minor market noise rather than tracking true institutional turning points. The 3 Bars High Low Indicator for MT4/MT5 removes this guesswork from your charting terminal. By using a strict algorithmic scanning filter, this advanced tool isolates significant swing points based on three-candle high and low relationships, providing day traders, scalpers, and Smart Money Concepts (SMC) enthusiasts with an objective roadmap of Market Structure.
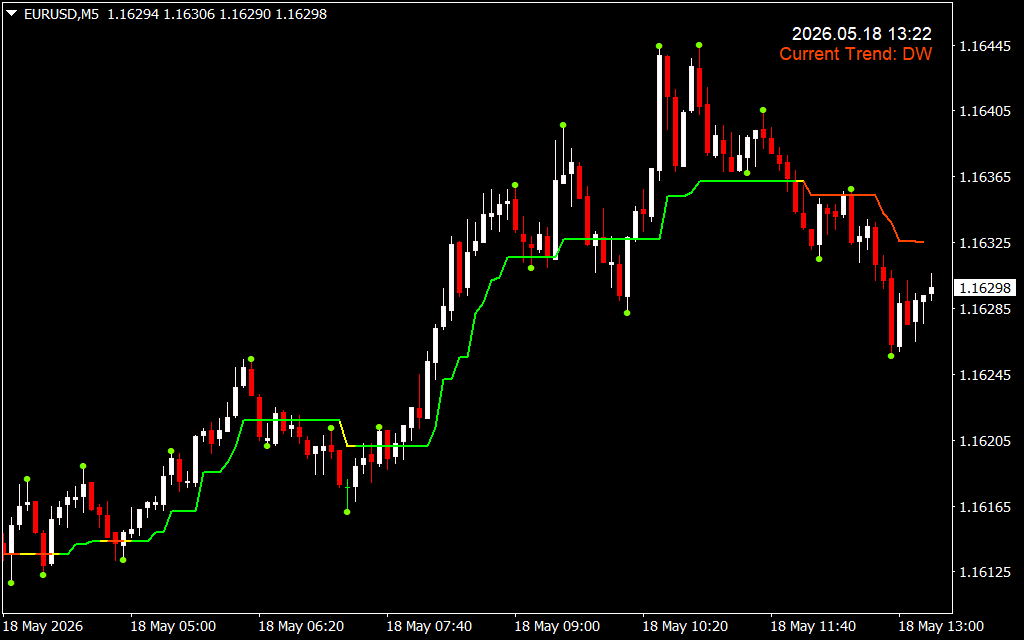
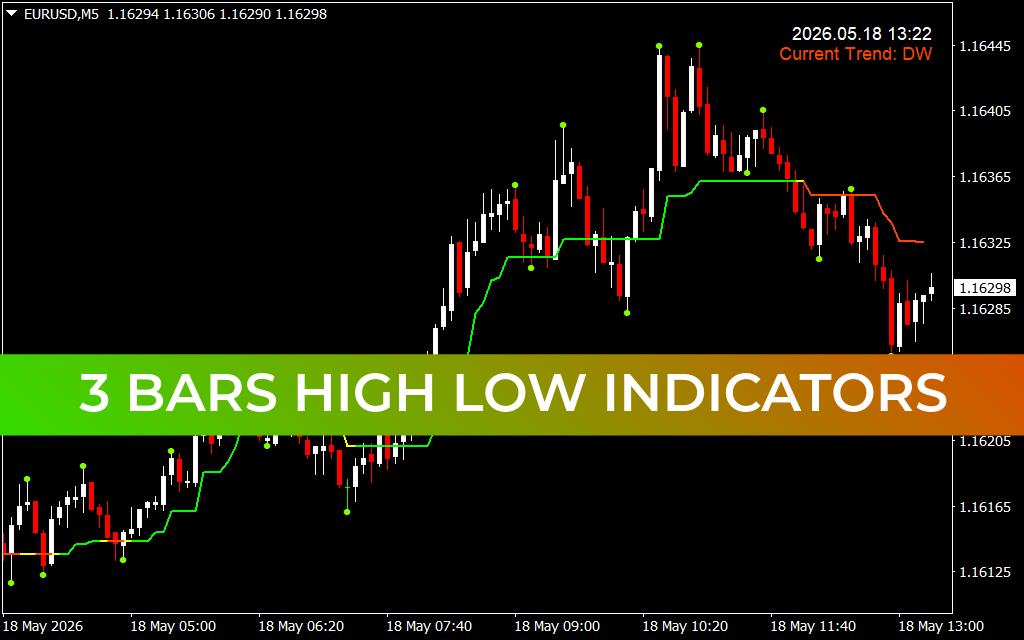
Decoding Structural Transitions on the EUR/USD M5 Chart
The provided EUR/USD 5-minute (M5) chart demonstrates how the 3 Bars High Low indicator cleanly visualizes intra-day market cycles. The indicator operates directly on the price field, drawing a continuous, stepped trend line that shifts from vibrant green during bullish structures to deep orange when the market transitions into a downward phase. It pairs this structural boundary with small green dots at key swing lows and swing highs.
During the early morning session of May 18, the asset established a strong accumulation floor near the 1.16125 region. Notice how the indicator maps this base with precision, trailing a flat green baseline just below the lowest structural dots. As buyers aggressively stepped into the market, pushing Price Action past the 1.16205 resistance level, the 3 Bars High Low line shifted upward in a clean, stepped fashion.
For high-frequency momentum scalpers, this stepped line serves as a dynamic trailing filter. As long as the price maintains its footing above the green steps, the bullish trend is structurally sound, allowing traders to comfortably hold long positions throughout the explosive vertical expansion up to the 1.16445 peak.
Maximizing Risk Management and Spotting Reversals
Beyond mapping active trend progressions, the 3 Bars High Low indicator excels at providing early warnings when a trend is losing structural integrity. Following the mid-day peak, the EUR/USD pair formed a localized double-top structure.
The indicator instantly flagged this exhaustion by printing green dots at the extreme highs and rolling over into an orange stepped profile as the price broke beneath the 1.16365 pivot zone. This color shift provides a clear visual signal that the immediate market bias has rotated from bullish to bearish. At the current price of 1.16298, the orange boundary acts as an overhead ceiling of resistance.
Using this tool simplifies risk management. Because the indicator relies on objective mathematical highs and lows, day traders can place their stop-loss orders exactly one pip beyond the most recent step or green dot, ensuring a tight and optimized risk-to-reward ratio. Whether you are Scalping quick intra-day moves or managing long-term swing positions, the 3 Bars High Low indicator delivers the structural clarity required to execute trades with complete confidence.
2 Downloads
Last Update:
May 18, 2026 16:24 PM
Published:
Jan 20, 2026 13:05 PM
Category: