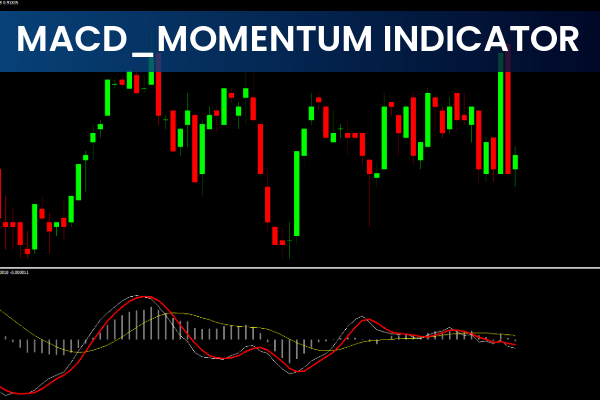
The Average Directional Index (ADX) is a popular technical indicator used to measure the strength of a trend.
However, many traders struggle to understand the +DI and –DI crossovers, making the original ADX indicator difficult to interpret.
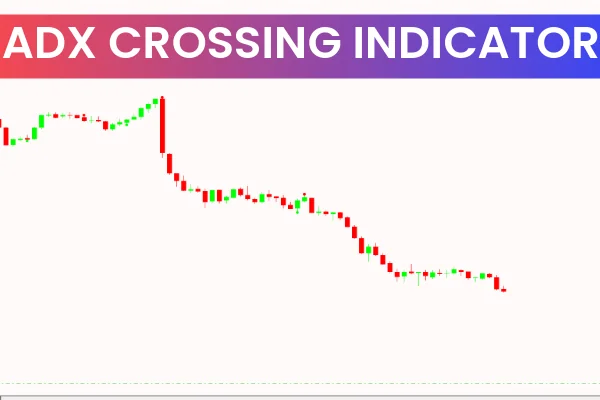
To solve this, the ADX Crossing Indicator for MT4 simplifies everything by replacing complex ADX lines with clear green and red dot signals, making trend identification easier for traders of all skill levels.
What the ADX Crossing Indicator Does
The indicator helps traders determine:
Trend direction
Trend strength
Potential entry points
It does this using:
Green dots → Buy signals
Red dots → Sell signals
These dots appear directly on the chart, removing confusion associated with traditional ADX calculations.
The indicator performs well in:
Trending markets
Ranging markets
Sideways markets
This versatility makes it a reliable trend-spotting tool.
How to Use the ADX Crossing Indicator
Traders can use the ADX Crossing Indicator alone for simple buy and sell entries.
However, the best results come when combining it with:
Candlestick patterns
This reduces false signals and improves trade accuracy.
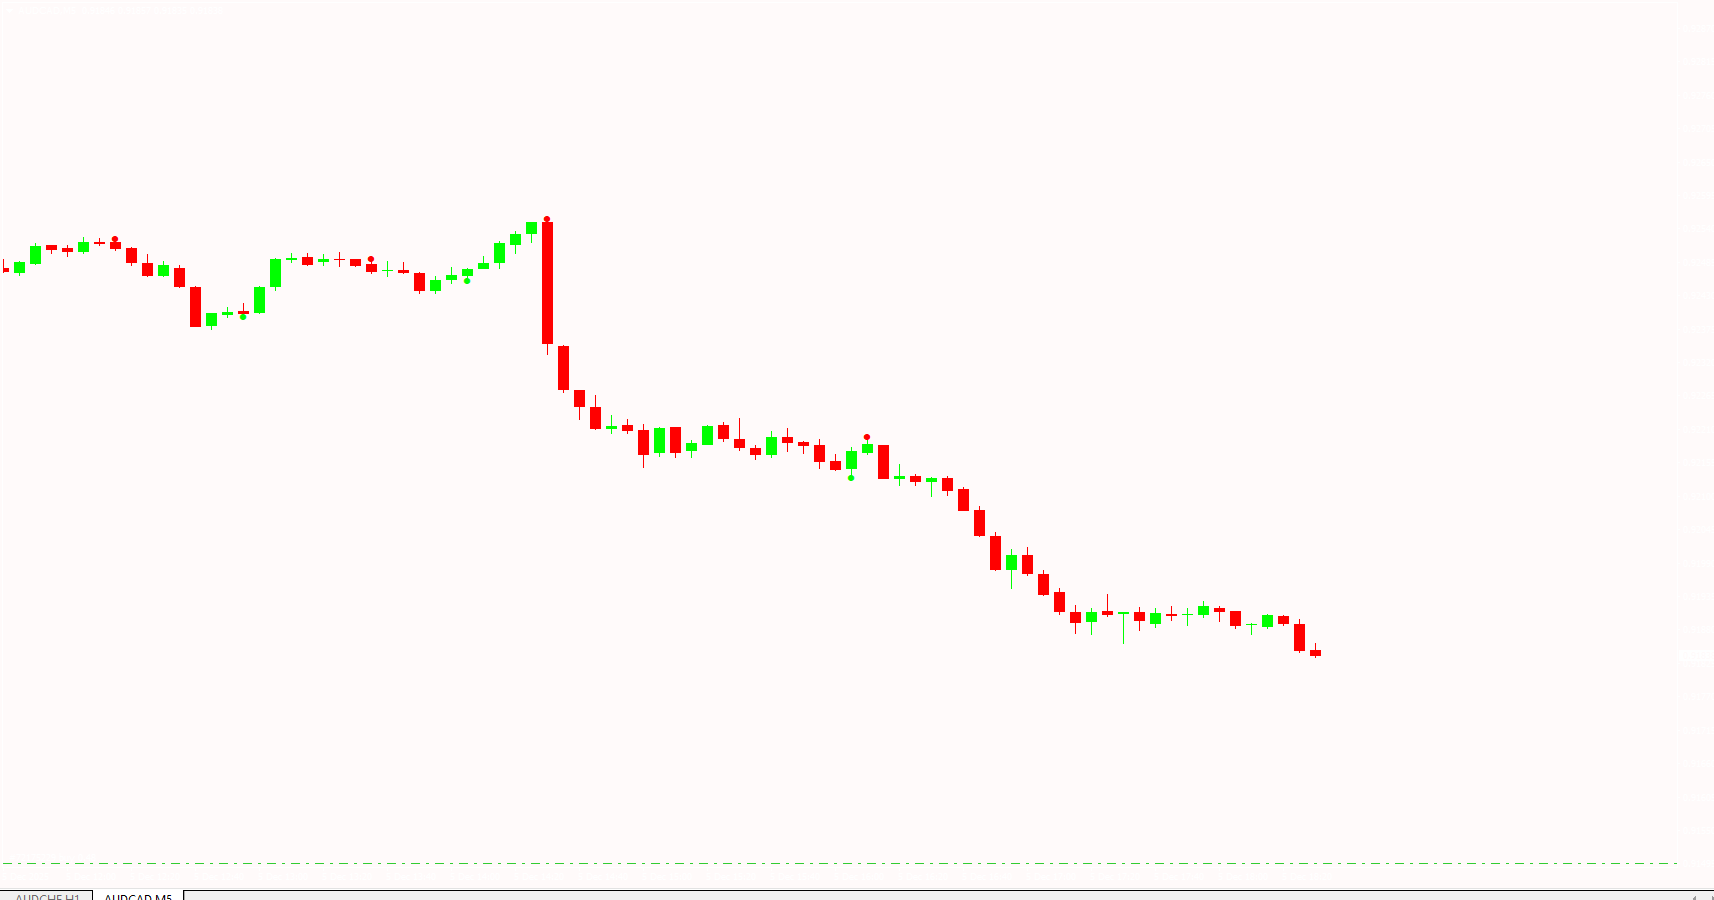
Chart Example: GBP/USD H4 Trading Strategy
Sell Signals
February 25, 2021 – Breakout at 1.4007
Price broke the support zone and retested it as resistance.
A pullback formed, followed by a red dot, signaling a sell entry.
March 04, 2021 – Second Retest
A strong rejection occurred at resistance.
ADX Crossing displayed another red dot → sell signal.
March 10, 2021 – Third Retest
A bearish engulfing candle formed at the resistance zone.
The indicator printed a red dot, confirming a short entry.
March 18, 2021 – Fourth Retest
A spinning-top candle appeared at resistance.
The indicator again showed a red dot, allowing another sell position.
Buy Signals
March 24, 2021 – Support at 1.3677
Price bounced at the major support zone.
April 12, 2021 – Second Retest
A bullish engulfing candle formed.
The ADX Crossing Indicator displayed a green dot, signaling a long trade.
Best Timeframes
H1
H4
Daily
These timeframes reduce market noise and increase signal accuracy.
Conclusion
The ADX Crossing Indicator for MT4 is a simple yet powerful tool that removes the complexity of traditional ADX analysis. With easy-to-read green and red dot signals, traders can quickly identify trend direction, momentum, and potential entry points.
For best results:
Combine with support and resistance
Use candlestick confirmations
Trade on higher timeframes such as H1, H4, and Daily
FAQ
Published:
Dec 05, 2025 12:38 PM
Category: