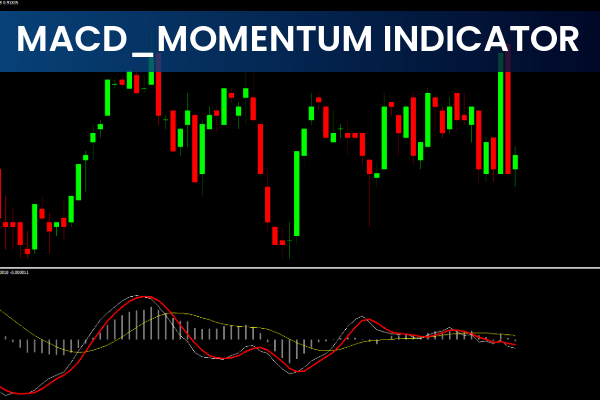
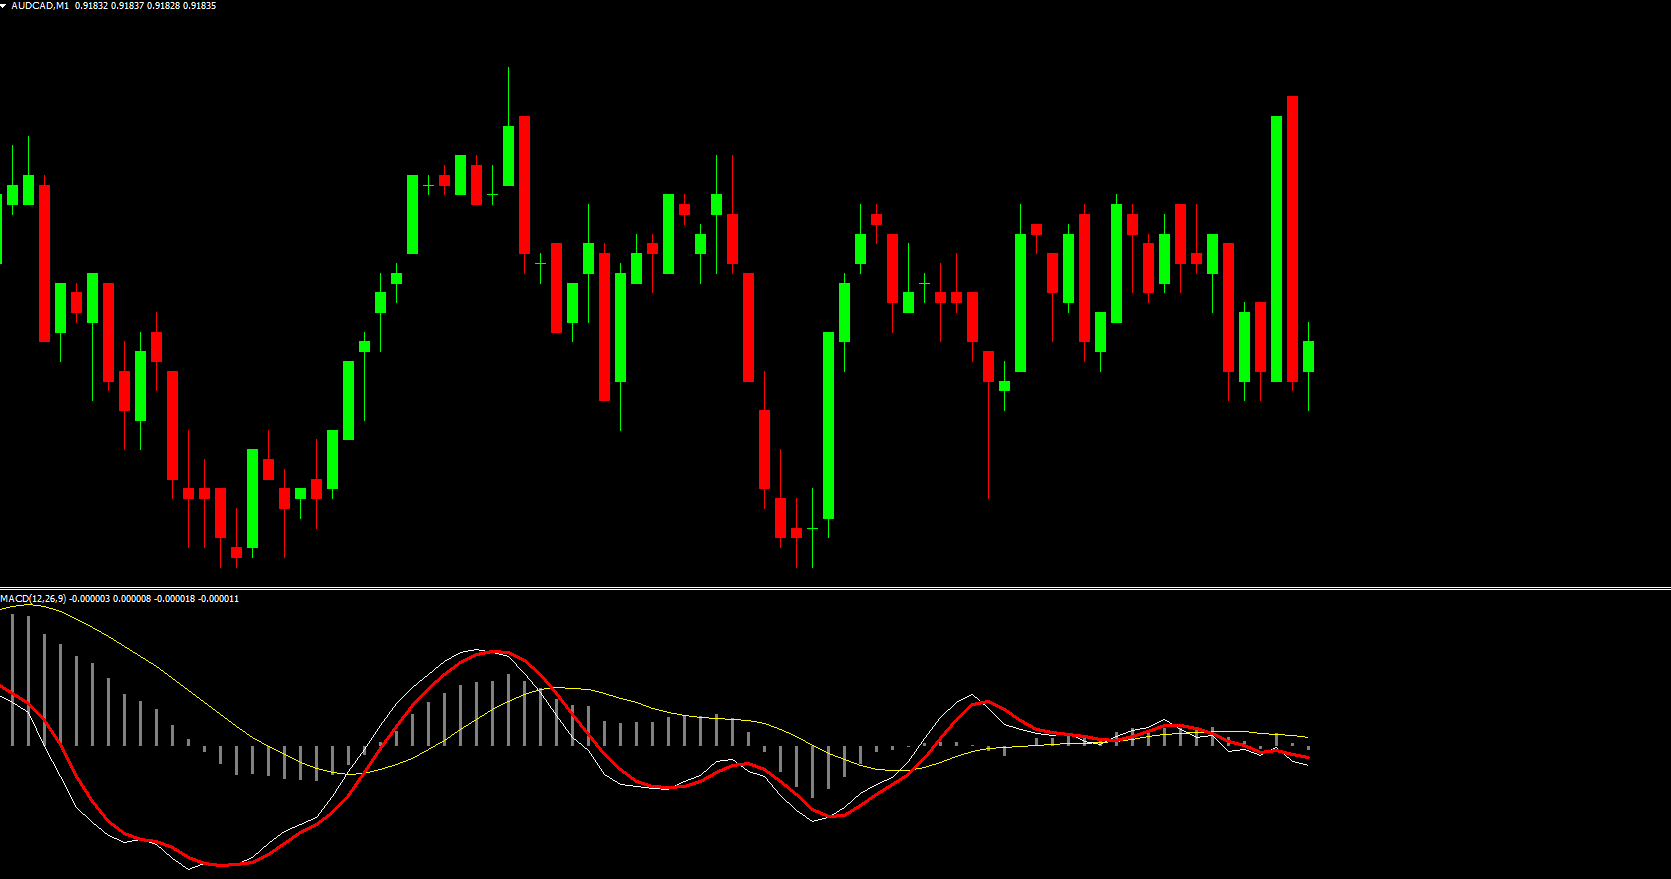
The MACD Momentum Indicator is a powerful trading tool that tracks the difference between simple and exponential moving averages of price. By using the MACD histogram bars, traders can quickly identify bullish or bearish momentum, making it an essential indicator for both beginner and expert traders. This indicator is widely used for forex, stocks, cryptocurrencies, and other financial instruments.
What is the MACD Momentum Indicator?
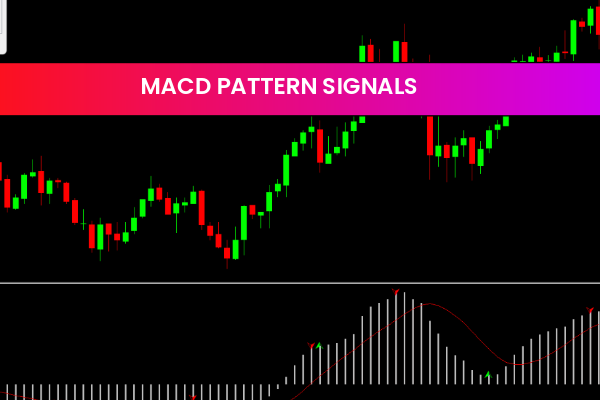
The MACD (Moving Average Convergence Divergence) Momentum Indicator measures the strength and direction of price movements. It visualizes momentum through histogram bars, with positive bars indicating bullish trends and negative bars signaling bearish trends. Its simplicity and clear signals have made it one of the most popular MetaTrader 4 (MT4) indicators.
Traders appreciate MACD Momentum for its:
Easy readability
Straightforward trading rules
Compatibility with all timeframes
How the MACD Momentum Indicator Works
The MACD Momentum combines three key elements:
Signal SMA (9-day) – shown as a red slope
Fast EMA (12-day) – represented in green
Slow EMA (26-day) – displayed in yellow
During bullish momentum, the fast EMA rises above the signal SMA while the histogram bars turn positive. For confirmation, the slow EMA should remain below all moving averages. Conversely, bearish momentum is confirmed when the fast EMA drops below the signal SMA and slow EMA, with histogram bars turning negative.
Trading Strategies with MACD Momentum
Bullish Trade Setup:
Enter a buy when the fast EMA crosses above the signal SMA
Ensure the histogram is positive
Close the position when histogram bars turn negative
Bearish Trade Setup:
Enter a sell when the fast EMA moves below both the signal SMA and slow EMA
Confirm with negative histogram bars
Take profit when bars turn positive
Experts recommend this indicator for Scalping, intraday trading, and long-term projections. Its flexibility makes it suitable for trend-following or swing trading strategies.
Benefits of Using MACD Momentum
Compatible with all MT4 timeframes
Works for forex, stocks, CFDs, and crypto trading
Enhances existing trading strategies
Ideal for both beginners and experienced traders
Using MACD Momentum can simplify technical analysis and improve trading accuracy, helping you make smarter, data-driven decisions.
Conclusion
The MACD Momentum Indicator is a must-have tool for MT4 traders. Its clear visualization of bullish and bearish momentum, along with easy integration into various strategies, makes it perfect for improving trading performance. Start using it today to gain an edge in forex, stocks, and crypto markets.
Visit IndicatorForest.com to download the MACD Momentum Indicator and explore more advanced trading tools.
FAQ
1 Download
Published:
Nov 13, 2025 01:41 AM
Category: