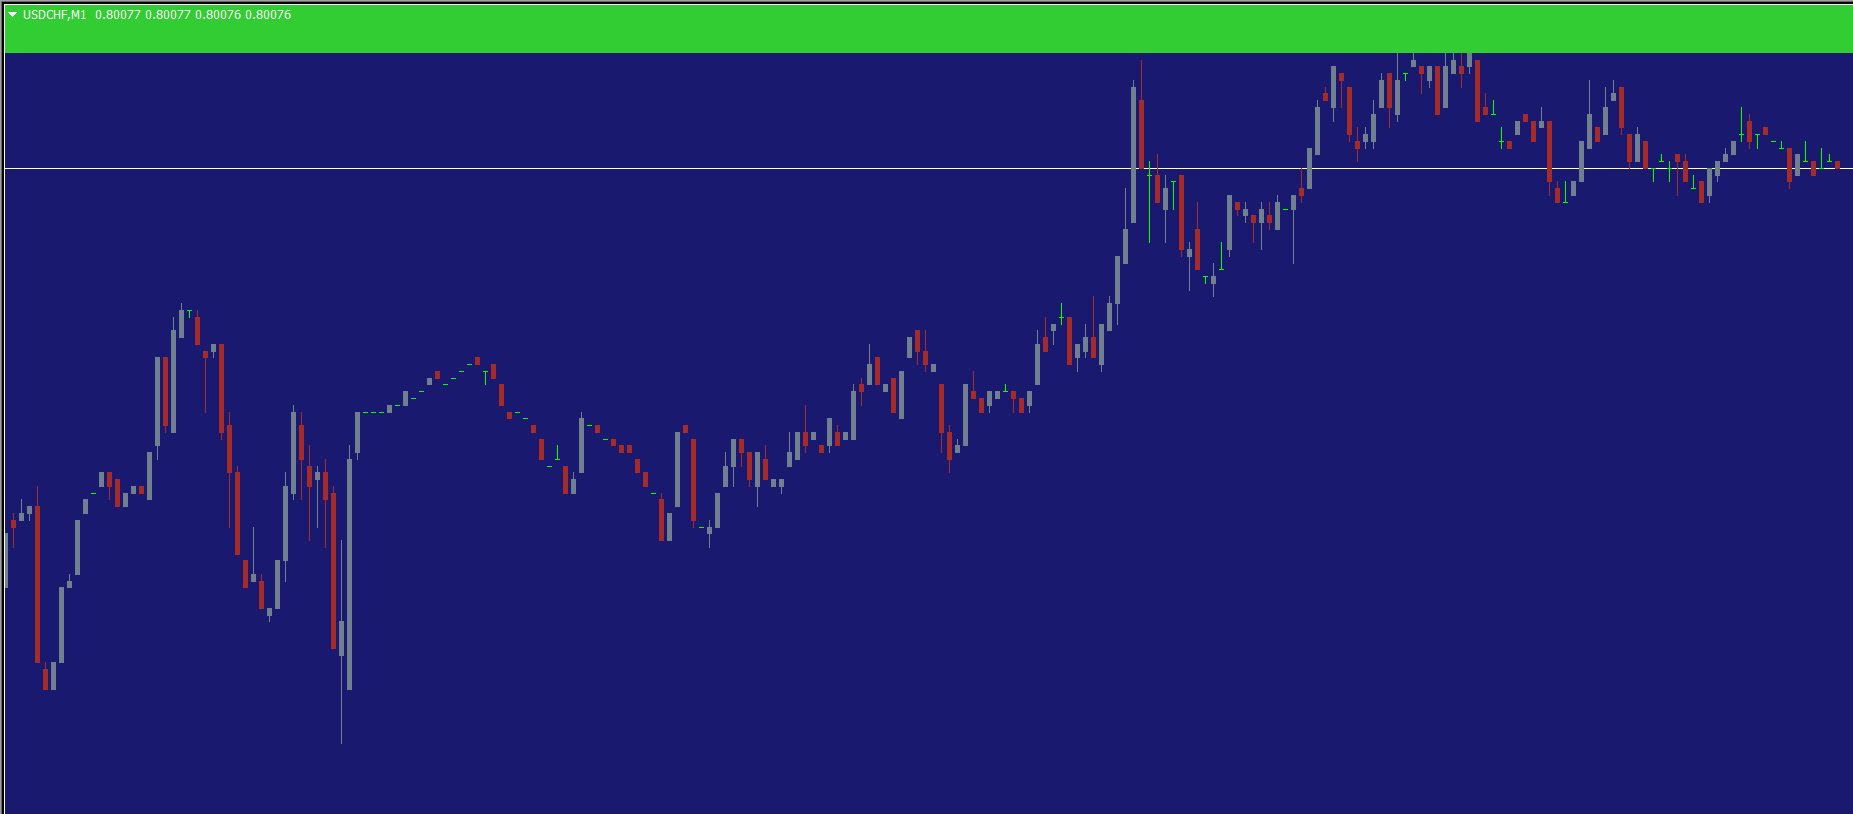
The Breakout Panca Eagle Indicator for MT4 is a simple yet powerful Forex trading tool that identifies potential breakout zones based on the Asian session’s high and low levels. This indicator plots a visual box from 0:00 to 5:30 hours, providing traders with clear breakout reference points for the rest of the trading day.
Forex traders use this breakout range to anticipate whether Price Action will continue in the direction of the breakout or reverse. When combined with proper risk management, this indicator can significantly improve intraday trading performance.
At IndicatorForest.com, we provide this and many other professional-grade tools to help traders make informed and profitable decisions.
How the Breakout Panca Eagle Indicator Works
The indicator automatically plots two key boxes on the MT4 chart:
A red box representing the breakout period (0.00–5.30).
A green box representing the full trading day (0.00–23.00).
The high and low prices during the Asian session act as resistance and support, respectively. When the price breaks above the high, it signals a potential buy opportunity; when it breaks below the low, it indicates a sell opportunity.
This time-based breakout method works exceptionally well on pairs with higher volatility, such as GBP/JPY, GBP/USD, and EUR/JPY.
Trading Strategy Using the Breakout Panca Eagle Indicator
Attach the indicator to any Forex pair on your MT4 platform.
Wait for the breakout box to form between 0.00 and 5.30 hours.
When the price closes above the high, enter a buy trade.
When the price closes below the low, enter a sell trade.
Place stop loss just beyond the opposite boundary of the box.
Target a risk-to-reward ratio (RR) of at least 1:2.
For enhanced accuracy, combine this setup with volume analysis or candlestick confirmation to filter out false breakouts.
Pros and Cons of the Breakout Panca Eagle Indicator
Pros:
Easy to use for beginners and professionals.
Works across all timeframes and currency pairs.
Provides clear visual levels for breakout confirmation.
Excellent for intraday trading strategies.
Cons:
Less effective for long-term trading.
Requires confirmation tools to avoid false signals.
Best Practices and Tips
Use on M15, M30, or H1 charts for optimal results.
Avoid trading during major news releases, as they can cause erratic price movements.
Test the indicator on a demo account before live trading.
Pair with a Momentum Indicator such as the RSI or MACD for stronger validation.
Comparison with Similar Indicators
If you enjoy trading breakouts, you might also explore the Forex Breakout Box Indicator and SQ Dynamic Breakout Box Indicator, which use similar concepts but different algorithms for detecting price ranges. These tools complement each other and can enhance your trading strategies when used together.
Conclusion
In summary, the Breakout Panca Eagle Indicator for MT4 is a highly effective, time-based breakout strategy tool that simplifies intraday trading. Its visual clarity and reliability make it a must-have for traders who thrive on structure and precision.
To discover more free and premium indicators, visit IndicatorForest.com — your go-to source for professional MT4 and MT5 trading tools.
Frequently Asked Questions (FAQ)
Does it work on all Forex pairs?
Yes, it performs well on all pairs, particularly on volatile ones like GBP/JPY.
Which timeframe is best?
It’s designed for intraday trading — M15, M30, and H1 are ideal.
Does it repaint?
No, the indicator’s breakout box is fixed once the day’s range is formed.
Is it suitable for Scalping?
Yes, but always confirm entries with additional indicators or price action.
Is it beginner-friendly?
Absolutely. The interface is simple and intuitive, making it great for new traders.
FAQ
1 Download
Published:
Nov 11, 2025 21:31 PM
Category: