Elevate Your Strategy with the QQE Histogram Indicator for MT4
In the pursuit of trading excellence, clarity is often the most valuable asset. The QQE (Quantitative Qualitative Estimation) Histogram is a sophisticated technical indicator that transforms traditional momentum analysis into a high-definition visual tool. Built upon the foundation of a smoothed Relative Strength Index (RSI), the QQE Histogram provides traders with a multi-layered view of market trends, volatility, and potential reversal points, making it a staple for those who demand precision in their MetaTrader 4 setup.
The Evolution of Momentum Analysis
The original QQE indicator was designed to eliminate the "jitter" often found in standard oscillators. By applying double smoothing techniques, it identifies the underlying trend without the noise of minor price fluctuations. The Histogram version takes this a step further by visualizing the relationship between the fast and slow trailing signal lines as vertical bars.
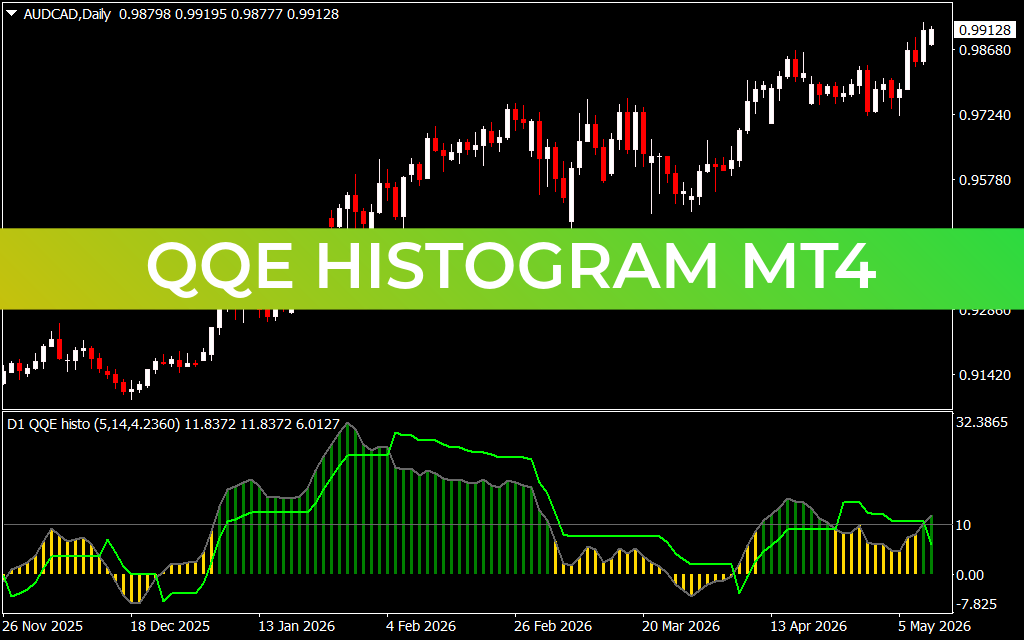
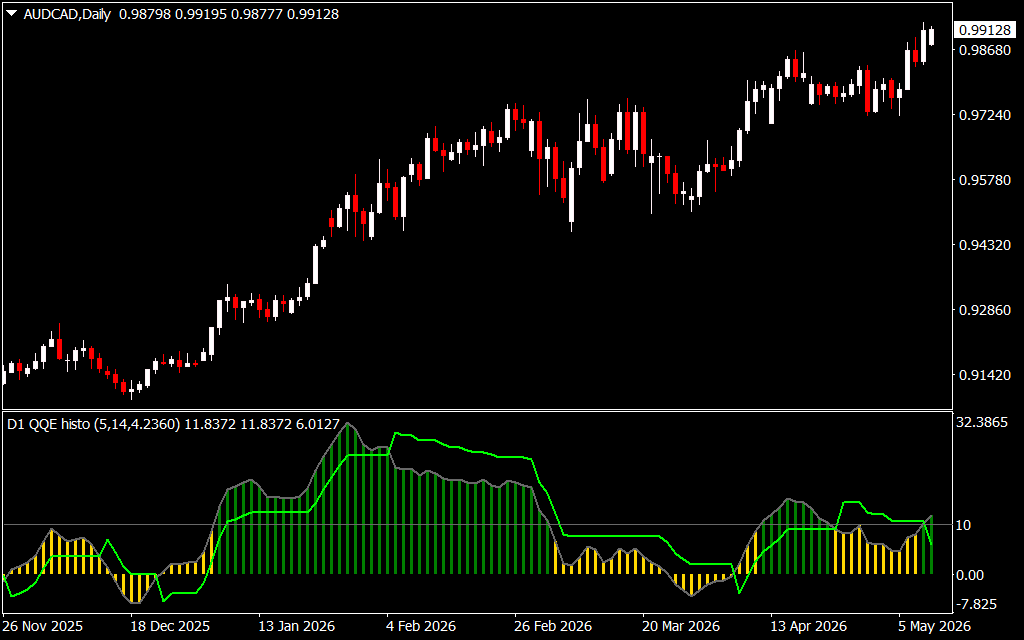
As demonstrated in the AUD/CAD daily chart, the indicator oscillates around a central zero line. The bars are color-coded to provide instantaneous feedback:
- Green Bars: Indicate strong bullish momentum where the fast line is above the slow line.
- Yellow/Gold Bars: Signal a potential shift or weakening in the current momentum, often serving as a warning to tighten stops.
- Grey/Dark Bars: Represent bearish phases or periods of low-conviction momentum.
Key Features and Trading Signals
The QQE Histogram is renowned for its ability to spot early trend changes that other indicators might miss. Here is how professional traders utilize its features:
- Zero-Line Crossovers: The most fundamental signal occurs when the histogram crosses the 0.00 level. A move from negative to positive territory suggests a shift in market sentiment from bearish to bullish.
- Color Transitions: The shift from green to yellow bars is a vital "qualitative" signal. It doesn't necessarily mean the trend is over, but it indicates that the rate of change is slowing—a crucial insight for exit timing.
- Divergence Identification: Just like the classic RSI, the QQE Histogram is an elite tool for spotting divergences. When price makes a new high but the histogram peaks are lower, it reveals hidden weakness in the move, allowing traders to anticipate reversals before they happen.
- Trend Confirmation: The smoothed signal lines (green and grey) act as dynamic levels. When the histogram is expanding away from these lines, it confirms a healthy, trending market.
Why Choose the QQE Histogram?
Unlike basic oscillators that frequently give "false" overbought or oversold readings during strong trends, the QQE Histogram excels at keeping traders on the right side of the market. Its mathematical smoothing ensures that you aren't shaken out by minor wicks, while the histogram format makes reading market strength as simple as glancing at the bottom of your screen.
Whether you are a day trader looking for scalp entries on the lower timeframes or a swing trader managing positions on the daily chart, the QQE Histogram for MT4 provides the objective, data-driven edge required to navigate today's volatile Forex markets.
2 Downloads
Last Update:
May 11, 2026 21:24 PM
Published:
Jan 24, 2026 13:37 PM
Category: