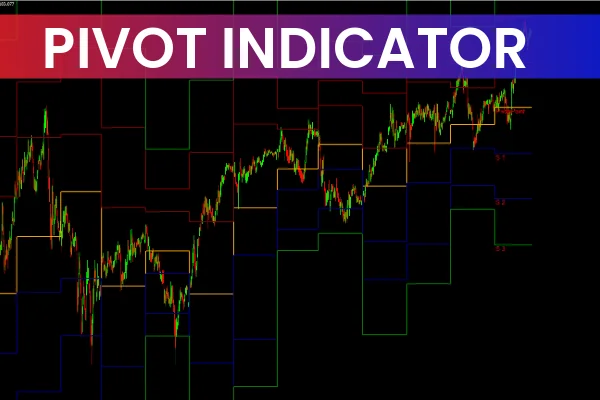
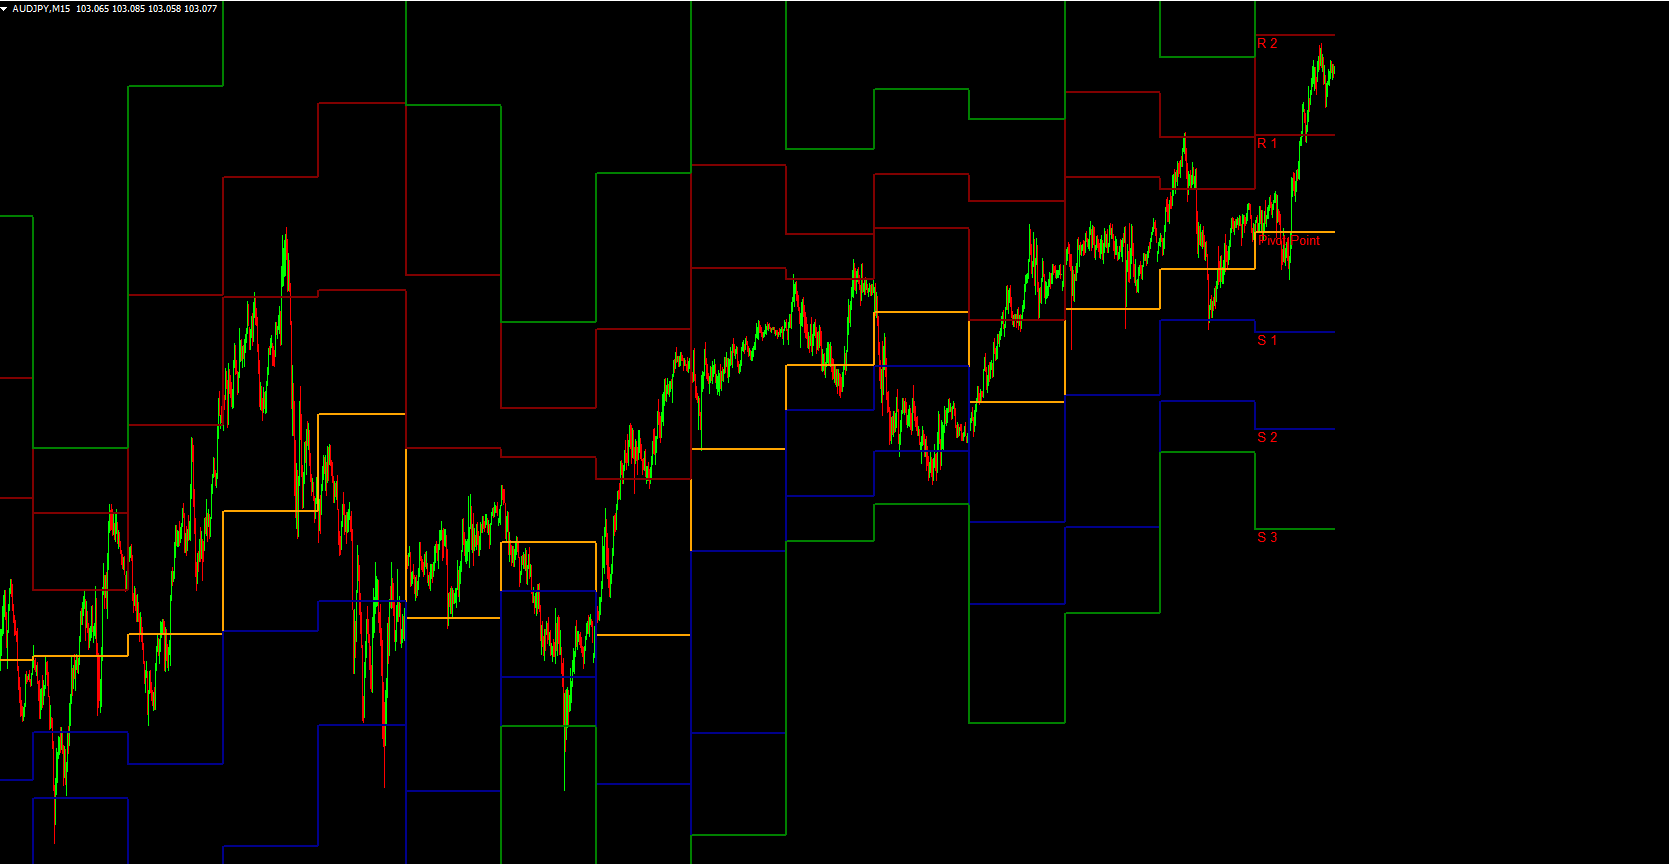
The Pivot indicator MT4 is a powerful tool that plots the classic daily pivot levels directly on your price chart. These include the Pivot Point (PP), three resistance levels (R1, R2, R3), and three support levels (S1, S2, S3). The indicator works up to the H4 timeframe and allows traders to anticipate potential reversal zones well in advance.
Because pivot points are calculated using the previous day’s price values, the indicator acts as a leading technical tool. It projects today’s levels at the start of each new trading session. Both beginner and advanced traders use pivot levels to identify entry zones, stop-loss areas, and take-profit levels. More experienced traders may also use pivot points in confluence with other indicators or integrate them into automated trading systems.
How Classic Pivot Lines Are Calculated
The classic pivot formula is simple yet highly effective:
Pivot = (High + Low + Close) / 3
R1 = (2 × Pivot) – Low
R2 = (Pivot – S1) + R1
R3 = (Pivot – S2) + R2
S1 = (2 × Pivot) – High
S2 = Pivot – (R1 – S1)
S3 = Pivot – (R2 – S2)
These values form the backbone of many technical trading strategies worldwide. Despite modern alternatives like Fibonacci, Camarilla, or DeMark pivot systems, the classic pivot indicator MT4 remains the most widely used version.
How the Pivot Indicator MT4 Works
Once applied to your chart, the indicator automatically plots pivot levels using distinct colors. For example, Pivot Point may appear in orange, Support levels in dark blue or green, and Resistance levels in maroon or red. This visual clarity helps traders quickly identify where price may stall, reverse, or break through.
Pivot levels act as psychological reversal points. When price approaches them, many traders anticipate a reaction. Because these levels are used by traders around the world, they tend to attract widespread participation, increasing the probability of meaningful price movement.
Using Pivot Points for Buy Signals
When price reaches S1, S2, or S3, it often reacts by bouncing upward. Traders look for bullish reversal patterns such as:
bullish engulfing
pin bars
rejection wicks
double bottoms
Once a valid bullish signal appears, a BUY position can be entered. The ideal stop-loss lies below the next lower support level or below the recent swing low.
Take-profit targets are commonly placed at the next pivot levels above, such as R1, R2, or R3. This method helps traders stay aligned with expected intraday Market Structure.
Using Pivot Points for Sell Signals
Similarly, if price climbs into R1, R2, or R3, traders watch for bearish reversal signals. These might include:
bearish engulfing
shooting stars
long upper wicks
double tops
After confirmation, traders open a SELL position. Profit targets are set at S1, S2, or S3, while the stop loss is placed above the previous swing high. Since pivot lines attract participation from many traders, these setups often provide consistent risk-reward opportunities.
Why Traders Prefer the Pivot Indicator
The Pivot indicator MT4 remains a favorite because:
It provides clear and accurate support/resistance zones
It is easy to understand, even for beginners
It works across all major forex pairs
It helps identify both reversal and continuation patterns
It improves trade timing during high-volatility sessions
It is free to download and easy to install
Pivot points also work well when combined with trend indicators, momentum oscillators, or candlestick analysis.
Conclusion
The Pivot indicator for MT4 helps traders align with market reversal zones, intraday trend continuation levels, and globally watched price points. Its ease of use and forecasting ability make it invaluable for both new and professional traders. Since it is free to download and simple to install, it remains one of the most popular tools for improving accuracy in forex trading.
For access to more premium indicators and expert trading tools, visit IndicatorForest.com.
FAQ
3 Downloads
Published:
Dec 06, 2025 01:53 AM
Category: