The TMA CG MTF Button Indicator for MT4 is a powerful tool for forex traders looking to identify overbought and oversold market conditions. By combining Triangular Moving Averages (TMA) and the Center of Gravity (CG) indicators, it provides precise trading signals and highlights the best entry points in any market.
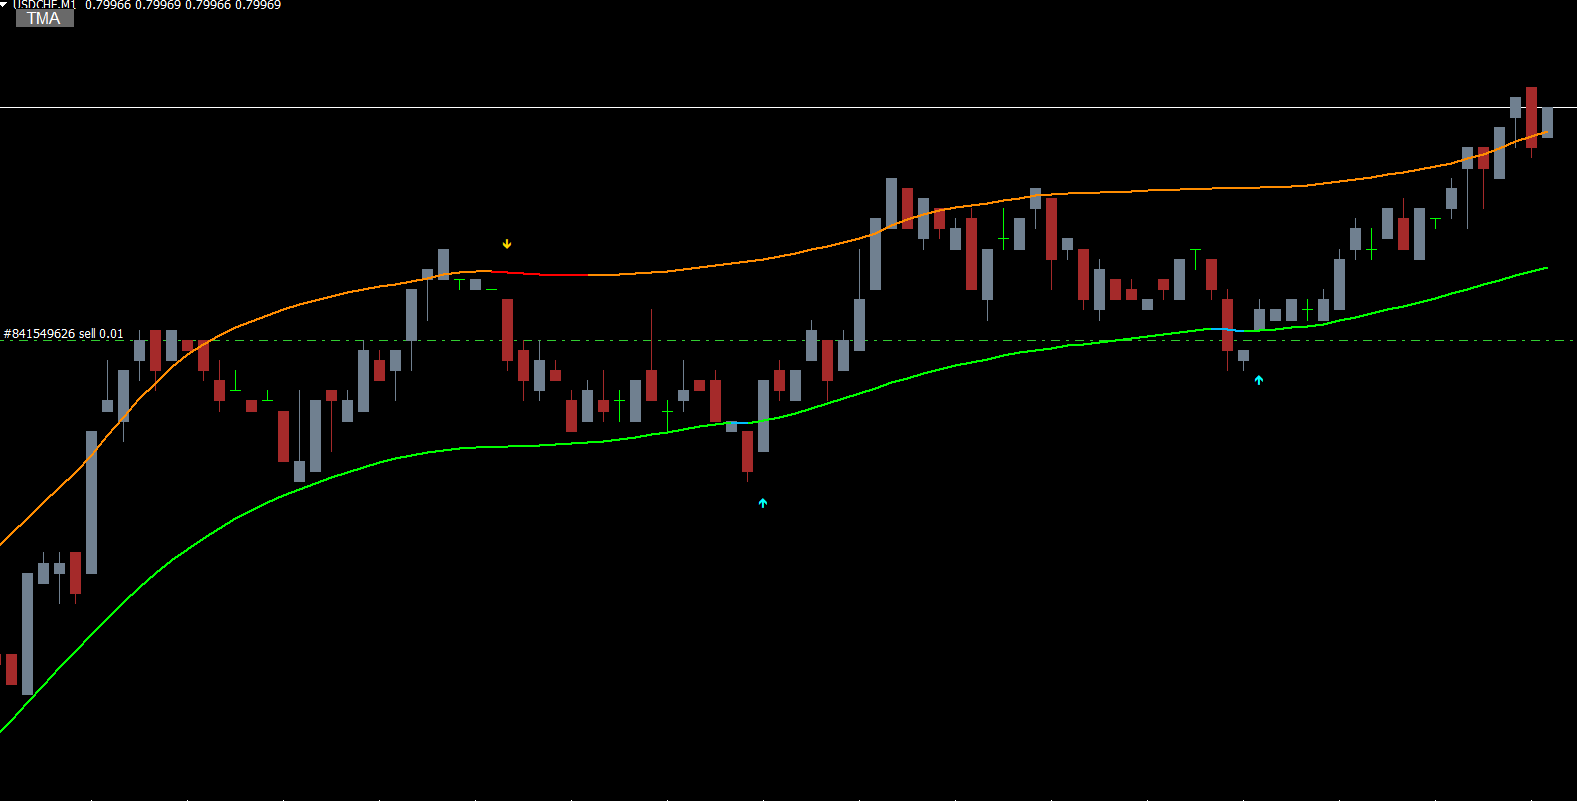
This indicator is suitable for both new and advanced traders and can be applied across all intraday charts as well as daily, weekly, and monthly timeframes. Traders can also select any timeframe for indicator calculation, giving flexibility in trading strategies. An integrated button allows users to enable or disable the indicator lines on the chart for a cleaner visual experience.
Features of the TMA CG MTF Button Indicator
Overbought and Oversold Signals: The indicator identifies extreme market conditions for potential reversal points.
Arrow Alerts: Plots up and down arrows on the chart for clear buy and sell signals.
Multi-Timeframe Support: Works effectively on intraday, daily, weekly, and monthly charts.
Customizable Display: A toggle button allows traders to hide or display indicator lines.
Flexible Timeframe Calculation: Traders can calculate signals on any timeframe, enhancing strategy versatility.
With these features, the TMA CG MTF Button Indicator is a valuable addition to any forex trader’s toolkit.
How to Trade with the TMA CG MTF Button Indicator
Trading with the TMA CG MTF Button Indicator is simple and efficient, relying on arrow signals and band interactions:
Buy Setup (Bullish Signal):
Wait for a green UP arrow signal, indicating bullish momentum.
Place a stop-loss below the previous swing low.
Exit the trade when a red down arrow appears or when the price reaches the opposite band.
Sell Setup (Bearish Signal):
Wait for a red DOWN arrow signal, indicating bearish momentum.
Place a stop-loss above the previous swing high.
Exit the trade when a green up arrow appears or when the price hits the opposite band.
Advanced Strategy: Multi-Timeframe Analysis
A more advanced approach is to calculate the indicator on a higher timeframe while observing signals on the current chart. This provides a broader perspective of market dynamics and helps traders align trades with the prevailing trend. Multi-timeframe analysis can enhance accuracy and reduce false signals, particularly in volatile markets.
Benefits of Using the TMA CG MTF Button Indicator
Accurate Reversal Signals: Helps identify overbought and oversold zones, improving timing for entries and exits.
Ease of Use: Arrow-based signals simplify trading decisions, especially for beginners.
Trend Confirmation: Combining TMA and CG ensures stronger trend validation and fewer false signals.
Versatile Application: Suitable for Scalping, intraday, swing, and position trading.
By incorporating the TMA CG MTF Button Indicator into your trading routine, you can improve trade precision, maximize profitability, and better manage risk in the forex market.
Conclusion
The TMA CG MTF Button Indicator for MT4 is an effective tool for detecting overbought and oversold conditions, offering clear arrow signals for profitable trading. Its combination of Triangular Moving Averages and Center of Gravity enhances market insights and ensures more reliable entries and exits.
Whether you are a beginner or an experienced trader, using this indicator can help you identify high-probability reversal points and improve your overall trading strategy.
Download the TMA CG MTF Button Indicator today and enhance your forex trading accuracy.
FAQ
8 Downloads
Published:
Dec 11, 2025 00:55 AM
Category: