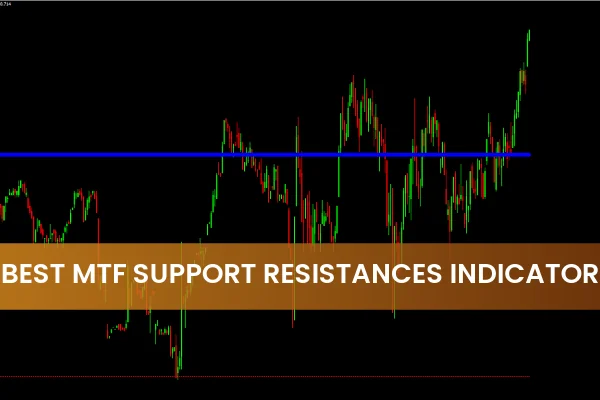
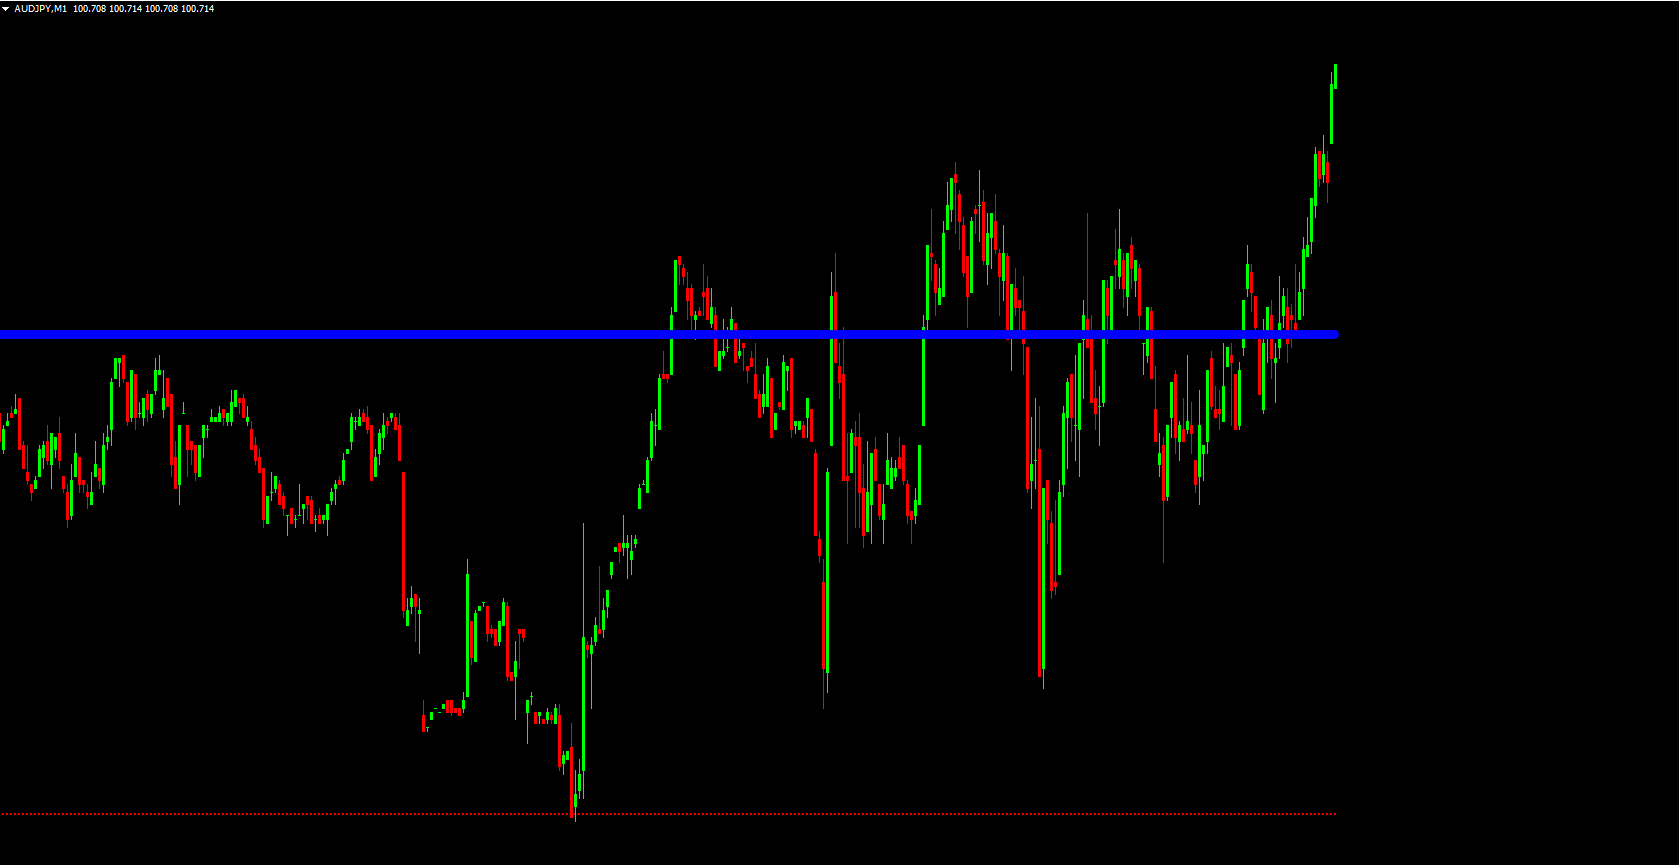
The Best MTF Resistance Support Indicator for MT4 is one of the most efficient tools for detecting major Support And Resistance levels in the forex market. This indicator automatically identifies critical price zones where the market is likely to reverse, pause, or continue a trend.
“MTF” stands for Multi-Time Frame, meaning this indicator analyzes multiple chart timeframes simultaneously. By combining data from higher and lower timeframes, it provides a clearer and more reliable map of key market levels — perfect for scalpers, day traders, and swing traders alike.
Support and resistance levels are the foundation of technical analysis. They represent areas where price has historically struggled to break above (resistance) or below (support). This indicator helps traders visualize those zones instantly without manually drawing lines.
Which Indicator Is Best for Support and Resistance?
There are several ways to identify support and resistance, including tools like moving averages, Fibonacci retracements, and trend lines. While these methods are effective, they often require experience and manual input.
The Best MTF Resistance Support Indicator for MT4 stands out because:
It’s automatic and beginner-friendly.
It provides multi-timeframe analysis, improving accuracy.
It clearly displays color-coded zones (red for resistance, blue for support).
It’s suitable for all levels of traders and trading styles.
This makes it one of the best indicators for accurately spotting pivotal zones where price reactions are most likely to occur.
How the Best MTF Resistance Support Indicator Works
Once applied to your MT4 chart, the indicator automatically plots dotted horizontal lines to mark key areas:
Red dotted lines: represent resistance levels where price has previously reversed downward.
Blue dotted lines: represent support levels where price has bounced upward.
These levels are derived from multiple timeframes, allowing traders to identify both short-term reaction zones and long-term trend barriers at a glance.
The indicator constantly updates as new data forms, ensuring that your chart always reflects the most current market conditions.
How to Trade with the Best MTF Resistance Support Indicator for MT4
Breakout Trading Strategy
Wait for the price to break through a resistance or support zone.
Confirm the breakout with a retest of the broken level.
Enter a BUY trade after a resistance breakout or a SELL trade after a support breakout.
Set your stop-loss just below (for buys) or above (for sells) the breakout candle.
Reversal Trading Strategy
Observe how price reacts when it approaches a marked support or resistance zone.
If the price fails to break a level and shows reversal patterns (e.g., pin bars, engulfing candles), anticipate a Trend Reversal.
For example, if the price bounces off a blue support level, look for buy opportunities.
These trading setups are most effective when combined with other tools like RSI, MACD, or trendlines for confirmation.
Advantages of the Best MTF Resistance Support Indicator
Multi-Timeframe Detection: Analyzes support/resistance levels from multiple timeframes automatically.
Accurate Visualization: Uses color-coded dotted lines for clear identification.
Adaptable to Any Strategy: Works with both breakout and reversal trading systems.
Saves Time: Eliminates manual plotting and analysis.
Suitable for All Traders: Great for beginners and professionals alike.
By combining the indicator with Price Action analysis, traders can identify high-probability entry points and manage trades more effectively.
Pro Trading Tips
Always confirm breakout signals with volume increase or momentum indicators.
Use higher timeframe support/resistance levels to guide lower timeframe trades.
Avoid entering trades too close to major resistance or support zones unless a breakout is confirmed.
Combine this indicator with tools like the Trend CCI or MACD to strengthen signal reliability.
Why Choose IndicatorForest.com
At IndicatorForest.com, we specialize in providing high-quality, free, and premium MetaTrader indicators that make forex trading easier and more profitable. The Best MTF Resistance Support Indicator for MT4 helps traders identify key price zones automatically, saving time and improving accuracy.
Download this indicator today from our website and explore more custom MT4 tools designed to enhance your trading performance and consistency.
FAQ
3 Downloads
Published:
Nov 11, 2025 21:13 PM
Category: