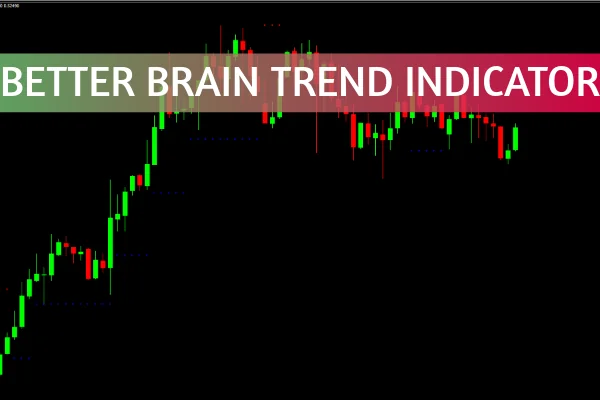
The Better Brain Trend Indicator for MT4 is a powerful tool designed to help traders identify potential market breakouts and reversals. Using an advanced algorithm based on Price Action and Average True Range (ATR) analysis, this indicator accurately detects changes in market sentiment and momentum direction. By understanding how to interpret its signals, traders can enhance their profitability and minimize risk in both forex and stock markets.
Understanding the Better Brain Trend Indicator
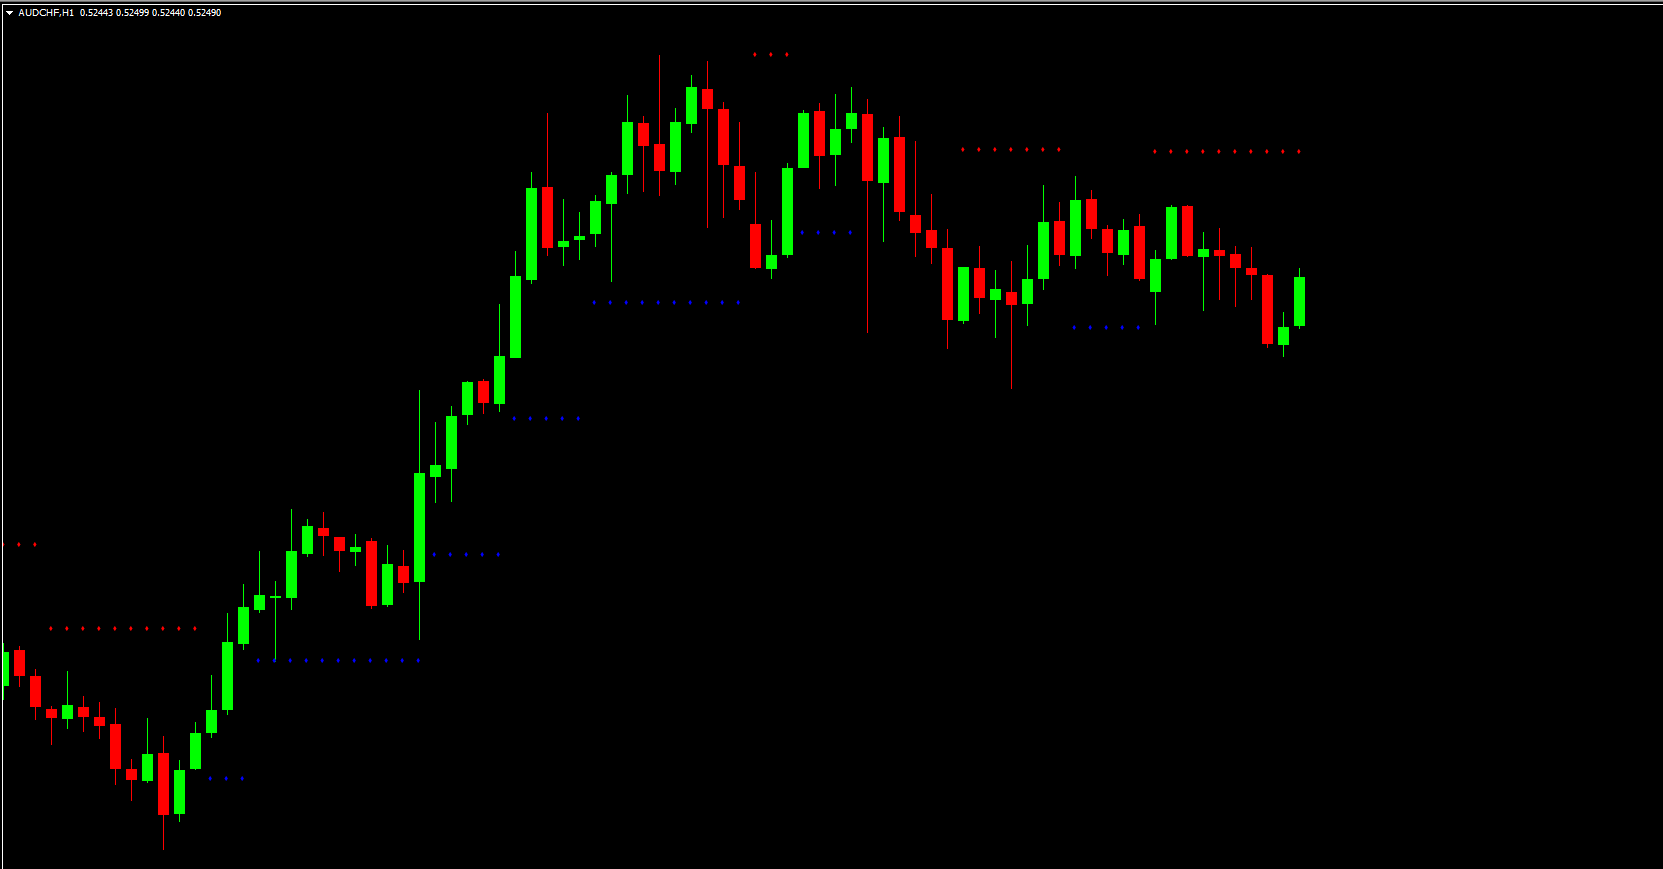
At its core, the Better Brain Trend Indicator evaluates recent market highs and lows to determine potential support and resistance levels. It visualizes these levels with colored dots on your MT4 chart:
Blue dots represent potential support zones.
Red dots highlight upcoming resistance zones.
These signals are derived from recent swing highs and lows, helping traders quickly spot areas where the price is likely to pause, reverse, or break out.
How the Indicator Detects Trend Direction
The Brain Trend algorithm compares current price movements with the ATR (Average True Range) to determine volatility-adjusted momentum.
When the price moves below support levels (blue dots), it suggests bearish momentum and possible sell opportunities.
Conversely, when the price breaks above resistance levels (red dots), it indicates bullish momentum and potential buy setups.
This dynamic behavior makes the Better Brain Trend Indicator a reliable companion for trend-following and breakout traders.
Trading Strategy: Step-by-Step
Let’s look at how to trade effectively using the Better Brain Trend Indicator on MT4:
Identify the Market Trend
Begin by observing the overall trend direction on a higher time frame (H4 or Daily). If the indicator consistently plots red dots above price, it confirms a downtrend. Conversely, blue dots below price suggest an uptrend.
Look for Breakout Signals
Wait for the price to break through a Brain Trend level:
Breakout below blue support = potential sell entry.
Breakout above red resistance = potential buy entry.
Confirm with Price Action
Use candlestick patterns or momentum indicators (like RSI or MACD) to confirm the breakout’s strength before entering the trade.
Manage Risk and Targets
Always set a stop-loss just beyond the nearest Brain Trend level. Target the next significant support/resistance or use a 1:2 risk-reward ratio for optimal trade management.
Example: EUR/USD H4 Chart
In a EUR/USD H4 scenario, the Better Brain Trend Indicator showed a bearish setup where the price consistently broke below blue support levels. Each time the breakout occurred, it offered a profitable short entry opportunity. When Support And Resistance levels appear closer together, it signals market consolidation—often followed by a strong bullish or bearish breakout. Monitoring these zones allows traders to anticipate high-probability trades.
Tips for Better Accuracy
Combine the Better Brain Trend Indicator with moving averages or volume indicators for added confirmation.
Avoid trading during high-impact news events, as volatility may cause false signals.
Use multiple time frames to confirm trend alignment before placing trades.
Conclusion
The Better Brain Trend Indicator for MT4 is a must-have tool for technical traders seeking to identify profitable breakouts and trend reversals. By analyzing recent highs, lows, and market volatility, it helps traders make data-driven decisions in both forex and stock markets.
Enhance your trading accuracy by pairing this indicator with complementary tools and solid risk management.
👉 Download advanced trading indicators now at IndicatorForest.com to elevate your trading performance.
Published:
Oct 31, 2025 04:01 AM
Category: