The RSI Extreme Zone Indicator MT4 is an advanced version of the traditional Relative Strength Index that focuses on identifying extreme market conditions. Like the classic RSI, it highlights overbought and oversold zones, but it goes a step further by visually marking potential reversal points using color changes and arrow signals. This makes it easier for traders to detect high-probability turning points in the market.
The RSI Extreme Zone Indicator MT4 is designed for traders who want clear momentum and reversal signals without complicated calculations. It helps determine market strength, trend direction, and potential price reversals across all timeframes. Whether you are a scalper, day trader, or swing trader, this indicator can be a valuable addition to your technical toolkit.
How the RSI Extreme Zone Indicator Works
The indicator oscillates between fixed levels similar to the standard RSI. However, instead of only showing numeric values, it highlights extreme conditions visually:
When the indicator moves above the centerline, it signals bullish momentum
When it drops below the centerline, it signals bearish momentum
Entry into overbought zones suggests possible bearish reversals
Entry into oversold zones suggests possible bullish reversals
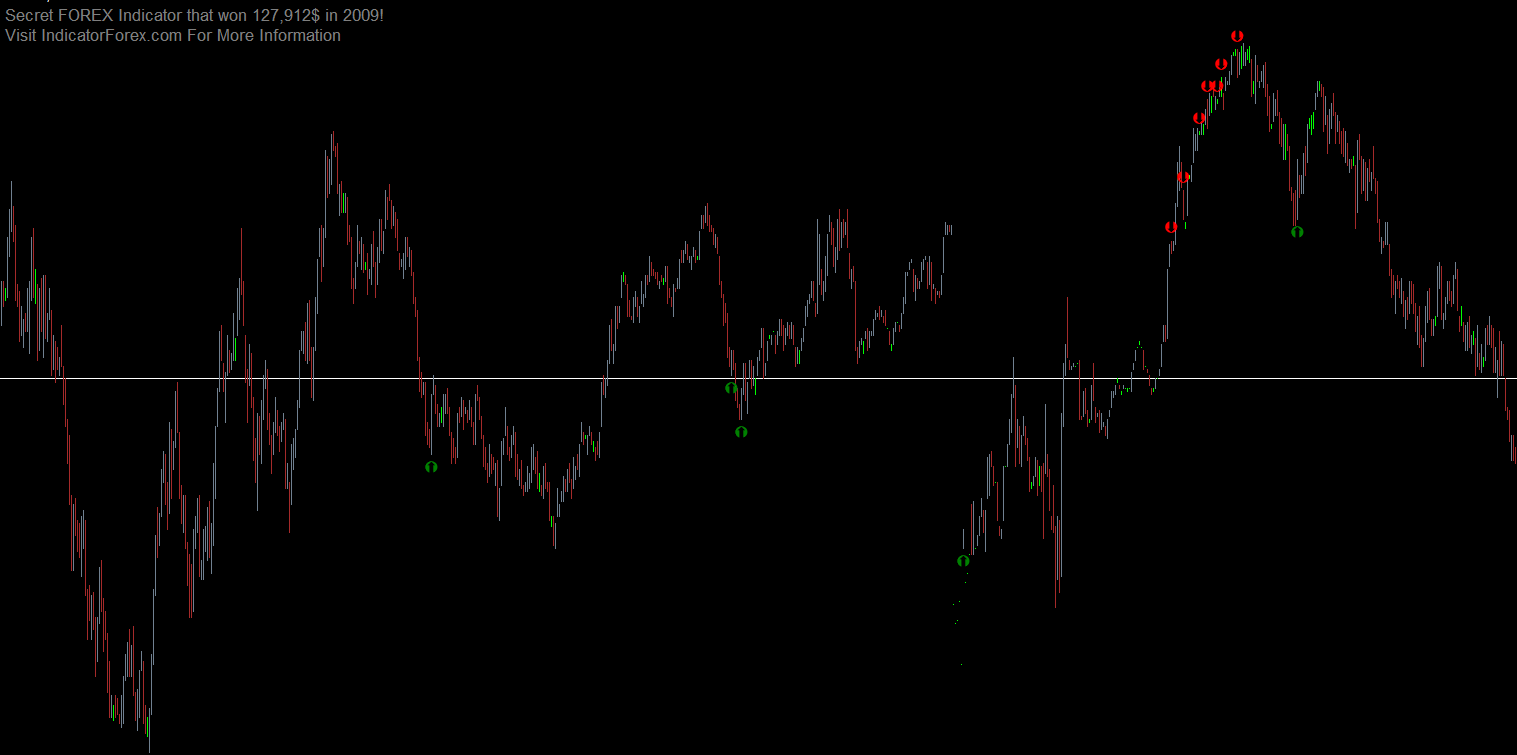
The most powerful feature of the RSI Extreme Zone Indicator MT4 is its automatic arrow signals that appear when price reaches extreme zones and a reversal is likely.
Buy and Sell Trading Signals
Buy Signal Setup
A buy signal forms when:
The indicator enters the oversold zone
The indicator line changes color to blue
A bullish arrow appears signaling a potential reversal
Traders should look to enter BUY positions at the early stage of a new uptrend. For better accuracy, Price Action confirmation is recommended. A stop loss can be placed below the recent swing low.
Sell Signal Setup
A sell signal appears when:
The indicator enters the overbought zone
The indicator line changes color to red
A bearish arrow points downward
This setup indicates a potential Trend Reversal to the downside. Stop loss should be placed above the recent swing high for proper risk control.
Best Trading Strategies Using RSI Extreme Zone Indicator MT4
The RSI Extreme Zone Indicator MT4 works best in combination with:
Trend direction tools (Moving Averages, SuperTrend)
Candlestick reversal patterns
Higher timeframe confirmation
Using confluence helps filter false signals and improves the probability of successful trades, especially during strong market trends.
Trading Example Explained
On a USD/JPY chart, after a strong downtrend, the indicator enters the oversold region. The RSI line changes color to blue and displays a bullish arrow. This signals a potential reversal, and price subsequently moves into a smooth bullish trend, covering over 250 pips.
Similarly, after an extended uptrend, the indicator enters the overbought zone. The RSI line turns red and displays bearish arrows, warning traders of a possible downward reversal.
Conclusion
The RSI Extreme Zone Indicator MT4 is an excellent tool for spotting trend reversals and identifying strong overbought and oversold conditions. With its clear color changes and arrow signals, it simplifies trading decisions and reduces emotional analysis. While powerful on its own, it performs best when combined with proper risk management and trend confirmation tools.
Visit IndicatorForest.com to download this indicator for free and explore more professional MT4 trading tools.
FAQ
The RSI Extreme Zone Indicator identifies extreme overbought and oversold conditions using the Relative Strength Index (RSI). It highlights when RSI reaches extreme levels that often precede reversals or significant price movements, helping traders identify high-probability entry and exit points based on momentum extremes.
When the indicator shows extreme overbought conditions (typically RSI above 70-80), it may signal potential downward reversals or corrections. When it shows extreme oversold conditions (typically RSI below 20-30), it may indicate potential upward reversals or bounces. These extreme zones help identify when momentum is stretched.
Enter buy trades when price reaches extreme oversold zones and shows signs of reversal, such as bullish price action patterns. Enter sell trades when price reaches extreme overbought zones with bearish reversal signals. Always confirm extreme zone signals with price action, support/resistance levels, or trend analysis to improve accuracy.
Extreme RSI levels often indicate that price has moved too far too fast, creating potential reversal opportunities. However, in strong trends, RSI can remain in extreme zones for extended periods, so always confirm with trend direction and price action before entering trades based solely on extreme readings.
The indicator works on all MT4 timeframes and currency pairs, making it suitable for scalping, intraday trading, and swing trading strategies. Extreme zones are particularly effective when combined with higher timeframe trend confirmation, helping traders avoid counter-trend trades during strong trending markets.
1 Download
Published:
Dec 14, 2025 22:00 PM
Category: